Transcription of Australian Shopping Centre Industry
1 Australian Shopping Centre IndustryScale and Performance Measures Prepared for Shopping Centre Council of Australia august 2015 Urbis Pty Ltd ABN 50 105 256 228 All Rights Reserved. No material may be reproduced without prior permission. You must read the important disclaimer appearing within the body of this report. URBIS Australia Asia Middle East URBIS STAFF RESPONSIBLE FOR THIS REPORT WERE: Director Rhys Quick Associate Director Brendan Drew Research Analyst Alyssa Cameron Job Code MPE1-2400 TABLE OF CONTENTS URBIS Shopping Centre Industry STATISCTICS august 2015 Australia s Retail Centres .. 1 Overview of Findings ..1 Scale and Performance Data ..2 Definitions .. 4 Disclaimer .. 5 URBIS Shopping Centre Industry STATISCTICS august 2015 1 Australia s Retail Centres This report presents current findings on the size and significance of Australia s Shopping centres, based on a top level audit conducted at the national and state level.
2 The data in this report updates key sections of previous reports issued to the Shopping Centre Council of Australia (SCCA) in April 2001 ( Shopping Centres in Australia, Vital Statistics), and March 2007 ( Australian Shopping Centre Industry , Information Update March 2007). OVERVIEW OF FINDINGS The audit has captured data for some 1,753 Shopping centres, comprised of 67 Regional centres, 286 Sub Regional centres, 1,104 Neighbourhood centres, 107 Central Business District (CBD) centres, 16 Outlet centres and 173 Other centres (including specialty centres, themed centres and markets). Note that this data excludes homemaker/large format retailer centres. [Refer Table 1, and Definitions] Within these centres there are an estimated 65,000 specialty shops. To ensure consistency across data sets used, specialty shops include all shops of less than 400 , including all retail specialties as defined by the SCCA Sales Reporting Guidelines, as well as non-retail shops such as travel, post office, banks etc.
3 24% are located in Regional centres, 29% in Sub Regional centres and 30% in Neighbourhood centres. [Refer Table 2] There is approximately million of lettable Shopping Centre floorspace in Australia, of which an estimated million or 82% is occupied by retail uses. New South Wales makes up approximately 30% of all Shopping Centre floorspace, whilst Tasmania, South Australia, Northern Territory and the Australian Capital Territory together make up only 12%. [Refer Table 3]. Victoria and Queensland have a significantly higher provision of Sub Regional Centre floorspace than Regional Centre floorspace. In New South Wales however, Regional and Sub Regional centres accommodate around the same floorspace. For the year ending June 2014, total aggregated Centre turnover was estimated at $ billion (inclusive of GST).
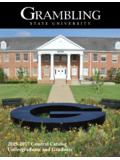
4 The retail component of aggregated Centre turnover was in the order of $120 billion. The Regional centres share was around 27% of all Centre turnover, Sub Regional centres 33%, Neighbourhood centres 32% and CBD centres 5%. [Refer Tables 5 and 6] The distribution of Shopping centres is further illustrated in the charts below, including the number of centres in each state/territory and retail turnover by Centre type. It should be noted that the data reflected in this report has been compiled with reference to the Property Council of Australia s (PCA) Shopping Centres Online database and Urbis proprietary databases. Together these data sources cover the vast majority of Regional and Sub Regional centres in Australia, although coverage of other Centre classes is less likely to be 100% complete.
5 NSW482(28%)VIC324(18%)QLD434(25%)SA168(1 0%)WA270(15%)TAS, 29(2%)NT, 21(1%)ACT, 25(1%) Shopping Centres by State/TerritorySource:PCA, UrbisRegional $32B(27%)Sub Regional $39B(33%)Neigh'hood$38B(31%)CBD, $6B(5%)Outlet, $2B(2%)Other, $3B(2%)Retail Turnover ($B) by Centre Type 2 URBIS Shopping Centre Industry STATISCTICS august 2015 SCALE AND PERFORMANCE DATA Table 1 - Shopping Centre Count, 2014 Centre TypeNSWVICQLDSAWATASNTACT(no.)(%)Regiona l25121646004674%Sub Regional846568283072228616%Neighbourhood 3021972701071811714161,10463%CBD31201617 174111076%Outlet27411001161%Other3823601 13514117310%Total Shopping Centres4823244341682702921251,753100%(%) of Australia27%18%25%10%15%2%1%1%100%Source : PCA Shopping Centres Online; UrbisTotal AustraliaTable 2 - Number of Specialty Shops, 2014 Centre TypeNSWVICQLDSAWATASNTACT(no.)
6 (%)Regional5,9563,3403,3888031,173008091 5,46924%Sub Regional5,1744,7074,7441,3972,3972182041 0318,94329%Neighbourhood5,7543,2765,0331 ,6043,37322326628719,81530%CBD1,60492060 550841411416184,1996%Outlet2587584531201 0200931,7843%Other8601,9031,357194573950 264,9728%Total Shopping Centres19,60614,90415,5804,6268,03256353 61,33665,183100%(%) of Australia30%23%24%7%12%1%1%2%100%Source : PCA Shopping Centres Online; UrbisTotal AustraliaNote: To ensure consistency across data sets used, specialty shops include all shops of less than 400 , including all retail specialties as defined by the SCCA Sales Reporting Guidelines, as well as non-retail shops such as travel, post office, banks etc. Table 3 - Retail Floorspace ( '000), 2014 Centre TypeNSWVICQLDSAWATASNTACT('000 )(%)Regional1,7871,0331,076276350002824, 80526%Sub Regional1,7491,6091,5085077579859406,327 34%Neighbourhood1,5551,0771,467506865818 2915,72531%CBD25216914712711712218274%Ou tlet5917895272100354152%Other15513419925 9311366263%Total Shopping Centres5,5584,1994,4921,4682,20319315645 518,724100%(%) of Australia30%22%24%8%12%1%1%2%100%Source : PCA Shopping Centres Online.
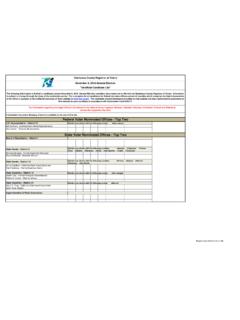
7 UrbisTotal Australia URBIS Shopping Centre Industry STATISCTICS august 2015 3 Table 4 - Total Shopping Centre Floorspace ( '000), 2014 Centre TypeNSWVICQLDSAWATASNTACT('000 )(%)Regional2,1301,2701,264358416003295, 76725%Sub Regional1,9961,8661,79362385310771467,35 632%Neighbourhood1,8901,2671,73156399196 1151036,75429%CBD61234220820914915911,54 67%Outlet66209116302100454882%Other26024 535134121113101,0355%Total Shopping Centres6,9555,1995,4641,8172,55021920853 422,946100%(%) of Australia30%23%24%8%11%1%1%2%100%Source : PCA Shopping Centres Online; UrbisTotal AustraliaChart 1 - Estimated Retail Turnover in Shopping Centres, 2014 Source : PCA Shopping Centres Online; - 5 10 15 20 25 30 35 40 NSWVICQLDSAWATASNTACTT urnover ($ bilion)Chart 2 - Estimated Total Shopping Centre Turnover, 2014 Source : PCA Shopping Centres Online; - 5 10 15 20 25 30 35 40 45 NSWVICQLDSAWATASNTACTT urnover ($ bilion) 4 URBIS Shopping Centre Industry STATISCTICS august 2015 Definitions For the purposes of this report, the following definitions are used: A Shopping Centre is defined as a major integrated retail Centre under single management with at least 1,000 of lettable retail floorspace.
8 Gross Lettable Area (GLA) is assessed according to the Property Council of Australia s Method of Measurement for Lettable Area and includes the leased area of all tenants located at the Centre , whether currently leased or not. The GLA includes storage, administrative and other ancillary areas that come within the walls of the tenant s floorspace, but excludes separate storage areas. Tenants with occupancy by way of land lease, such as freestanding pad sites, are included for GLA purposes using the building area as the basis for measurement. Retail refers to the Australian Bureau of Statistics (ABS) definition adopted for the purposes of the 1991/92 Retail and Services Census, with some minor exclusions. This definition includes Total Shopfront Retailing less garden supplies and marine equipment.
9 Motor vehicle and related retailers are also excluded. Total Shopping Centre floorspace and turnover includes retail and non-retail uses. Turnover is sales including GST. A Regional Shopping Centre is defined as a major integrated retail Centre under single management and based on either: at least one department store or discount department store (DDS) of minimum 10,000 GLA, AND the Centre contains total reporting GLA in excess of 25,000 ; OR three full line DDSs or equivalent each of minimum 5,000 GLA, AND the Centre contains total reporting GLA in excess of 50,000 A Sub Regional Shopping Centre is built around one or two major DDSs, one or more supermarkets, and includes specialty shops. A Neighbourhood Centre is usually less than 10,000 in size and comprises one or two supermarkets along with a collection of food and non-food specialty shops and services in the same Centre under single management.
10 For the purposes of this report, the Neighbourhood Centre category includes centres with: at least one Food and Grocery anchor tenant of 400 or larger OR only one DDS which is smaller than 4,000 CBD Centres are retail centres located in the central business districts of Australian capital cities. They may be either anchored by a major retailer ( department store) or be a significant retail arcade in their own right. CBD centres are typically located within the retail core but may be positioned outside it (but still within the CBD). Other Centres include remaining Shopping Centre types that do not fall within the other classifications ( markets, specialty centres with no anchors and located outside of CBDs, themed centres etc.). Specialty Shops include all shops of less than 400 , including all retail specialties as defined by the SCCA Sales Reporting Guidelines, as well as non-retail shops such as travel, post office.