Transcription of Average SAT Scores of College-Bound Seniors (1952 ...
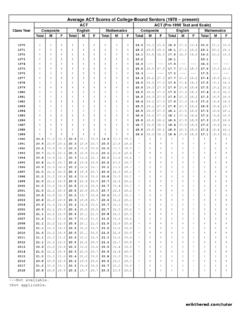
1 Average SAT Scores of College-Bound Seniors (1952 present ). SAT1 SAT (1941-42 scale). Class Year Verbal / Critical Reading / ERW Mathematics Writing2 Verbal Mathematics Total Male Female Total Male Female Total Male Female Total Male Female Total Male Female 1952 --- --- --- --- --- --- 476 --- --- 494 --- --- 1953 --- --- --- --- --- --- 476 --- --- 495 --- --- 1954 --- --- --- --- --- --- 472 --- --- 490 --- --- 1955 --- --- --- --- --- --- 475 --- --- 496 --- --- 1956 --- --- --- --- --- --- 479 --- --- 501 --- --- 1957 --- --- --- --- --- --- 473 --- --- 496 --- --- 1958 --- --- --- --- --- --- 472 --- --- 496 --- --- 1959 --- --- --- --- --- --- 475 --- --- 498 --- --- 1960 --- --- --- --- --- --- 477 --- --- 498 --- --- 1961.
2 --- 474 --- --- 495 --- --- 1962 --- --- --- --- --- --- 473 --- --- 498 --- --- 1963 --- --- --- --- --- --- 478 --- --- 502 --- --- 1964 --- --- --- --- --- --- 475 --- --- 498 --- --- 1965 --- --- --- --- --- --- 473 --- --- 496 --- --- 1966 --- --- --- --- --- --- 471 --- --- 496 --- --- 1967 543 540 545 516 535 495 466 463 468 492 514 467. 1968 543 541 543 516 533 497 466 464 466 492 512 470. 1969 540 536 543 517 534 498 463 459 466 493 513 470. 1970 537 536 538 512 531 493 460 459 461 488 509 465. 1971 532 531 534 513 529 494 455 454 457 488 507 466. 1972 530 531 529 509 527 489 453 454 452 484 505 461. 1973 523 523 521 506 525 489 445 446 443 481 502 460. 1974 521 524 520 505 524 488 444 447 442 480 501 459.
3 1975 512 515 509 498 518 479 434 437 431 472 495 449. 1976 509 511 508 497 520 475 431 433 430 472 497 446. 1977 507 509 505 496 520 474 429 431 427 470 497 445. 1978 507 511 503 494 517 474 429 433 425 468 494 444. 1979 505 509 501 493 516 473 427 431 423 467 493 443. 1980 502 506 498 492 515 473 424 428 420 466 491 443. 1981 502 508 496 492 516 473 424 430 418 466 492 443. 1982 504 509 499 493 516 473 426 431 421 467 493 443. 1983 503 508 498 494 516 474 425 430 420 468 493 445. 1984 504 511 498 497 518 478 426 433 420 471 495 449. 1985 509 514 503 500 522 480 431 437 425 475 499 452. 1986 509 515 504 500 523 479 431 437 426 475 501 451. 1987 507 512 502 501 523 481 430 435 425 476 500 453.
4 1988 505 512 499 501 521 483 428 435 422 476 498 455. 1989 504 510 498 502 523 482 427 434 421 476 500 454. 1990 500 505 496 501 521 483 424 429 419 476 499 455. 1991 499 503 495 500 520 482 422 426 418 474 497 453. 1992 500 504 496 501 521 484 423 428 419 476 499 456. 1993 500 504 497 503 524 484 424 428 420 478 502 457. 1994 499 501 497 504 523 487 423 425 421 479 501 460. 1995 504 505 502 506 525 490 428 429 426 482 503 463. 1996 505 507 503 508 527 492 --- --- --- --- --- --- 1997 505 507 503 511 530 494 --- --- --- --- --- --- 1998 505 509 502 512 531 496 --- --- --- --- --- --- 1999 505 509 502 511 531 495 --- --- --- --- --- --- 2000 505 507 504 514 533 498 . 2001 506 509 502 514 533 498.
5 2002 504 507 502 516 534 500 . 2003 507 512 503 519 537 503 . 2004 508 512 504 518 537 501 . 2005 508 513 505 520 538 504 . 2006 503 505 502 518 536 502 497 491 502 . 2007 501 503 500 514 532 499 493 487 499 . 2008 500 502 499 514 532 499 493 486 499 . 2009 499 502 497 514 533 498 492 485 498 . 2010 500 502 498 515 533 499 491 485 497 . 2011 497 500 495 514 531 500 489 482 496 . 2012 496 498 493 514 532 499 488 481 494 . 2013 496 499 494 514 531 499 488 482 493 . 2014 497 499 495 513 530 499 487 481 492 . 2015 495 497 493 511 527 496 484 478 490 . 2016 494 496 493 508 524 494 482 475 487 . 2017 533 532 534 527 538 516 . ---Not available. Not applicable. 1. Data for 1967 to 1986 were converted to the recentered scale by using a formula applied to the original mean and standard deviation.
6 For 1987 to 1995, individual student Scores were converted to the recentered scale and then the mean was recomputed. For 1996 to 1999, nearly all students received Scores on the recentered scale; any score on the original scale was converted to the recentered scale prior to recomputing the mean. From 2000 to 2016, all Scores were reported on the recentered scale. From 2017 on, the scale for the version of the SAT introduced in March, 2016 is used. 2. Writing data are based on students who took the SAT writing section, which was introduced in March 2005. The class year refers to the year in which an academic year ends and the graduating year for the senior class. For example, 1980 refers to the academic year 1979-1980 and the data shown for this date include Seniors in the class of 1980.
7 Data prior to class year 1967 include all tests taken by all participants and may include a small number of students other than Seniors . Data for class years 1967 through 1971 are estimates derived from the test Scores of all participants. Data for class years 1972 through 2006 include Seniors who took the SAT any time during their high school years through March of their senior year. Data for class years 2007 to 2015 include Seniors who took the SAT any time during their high school years through June of their senior year. Data for class year 2016 includes Seniors who took the SAT any time during their high school years through January, 2016. If a student took a test more than once, the most recent score was used.
8 The SAT was formerly known as the SAT I: Reasoning Test and the Scholastic Aptitude Test. Possible Scores on each part of the SAT range from 200 to 800. The Verbal section became known as the Critical Reading section in 2005, which in turn became the Evidence-Based Reading and Writing section in 2016. SOURCES: college Entrance Examination Board, College-Bound Seniors : Total Group Profile [National] Report;. college Board, Report on Declining SAT Scores (1977); National Center for Education Statistics ( ).