Transcription of BALANCE OF PAYMENTS REPORT - bsp.gov.ph
1 DEPARTMENT OF ECONOMIC STATISTICS. Monetary and Economics Sector Bangko Sentral ng Pilipinas BALANCE OF PAYMENTS . REPORT . 1st Quarter 2021. BANGKO SENTRAL NG PILIPINAS. BALANCE OF PAYMENTS : Q1 2021 (YoY). HEADLINE FIGURES. OVERALL BOP POSITION. -US$ (deficit). from US$68M. CURRENT ACCOUNT CAPITAL ACCOUNT FINANCIAL ACCOUNT *. -US$614M +US$17M +US$ (deficit) (surplus) (net outflows). from +US$225M from +US$12M from +US$3B. CURRENT ACCOUNT. PRIMARY SECONDARY. GOODS SERVICES. INCOME INCOME. -US$ +US$ +US$567M +US$7B. (deficit) (net receipts) (net receipts) (net receipts). from US$ from +US$ from +US$ from +US$ FINANCIAL ACCOUNT *. DIRECT PORTFOLIO FINANCIAL OTHER. INVESTMENT INVESTMENT DERIVATIVES INVESTMENT.
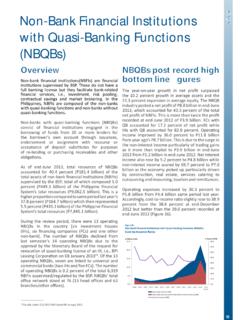
2 -US$ +US$ -US$111M -US$2B. (net inflows) (net outflows) (net inflows) (net inflows). from -US$883M from +US$793M from -US$74M from +US$ GROSS INTERNATIONAL US$ +US$ US$ RESERVES end-March 2020 + end-March 2021. $1 $1 EXCHANGE. Q1 2020 appreciation Q1 2021 RATE. * In the Financial Account, a positive (negative) BALANCE indicates an outflow (inflow). For graphical presentation purposes, inflows (outflows) are reflected as positive (negative) bars. Department of Economic Statistics BALANCE OF PAYMENTS REPORT . First Quarter 2021 Developments Overall BOP Position Q1 2021 BOP The country's BALANCE of PAYMENTS (BOP) position recorded a deficit position posts a of US$ billion in Q1 2021, higher than the US$68 million deficit higher deficit.
3 Posted in the same quarter in 2020. The increase in the BOP deficit stemmed from the uptick in net outflows in the financial account, coupled with the reversal of the current account from a surplus to a deficit during the period. The increase in net outflows in the financial account emanated mainly from the portfolio investment account, primarily due to the rise in the Central Bank's net investments in non-reserve assets as well as the Government's and Other Sectors'. higher net repayments of maturing bond Meanwhile, the current account reversed to a deficit as the merchandise trade gap widened on account of the growth in imports amid the gradual reopening of the domestic economy due to the easing of COVID-19.
4 Containment measures. Lower net receipts of primary income also contributed to the current account deficit. Figure 1. Main BALANCE of PAYMENTS Accounts, in million US dollars Q1 2021. 1. Other Sectors cover the following economic sectors: (a) other financial corporations, which include private and public insurance corporations, holding companies, government financial institutions, investment companies, other financial intermediaries except insurance, trust institutions/corporations, financing companies, securities dealers/brokers, lending investor, Authorized Agent Banks (AAB) forex corporations, investment houses, pawnshops, credit card companies, offshore banking units (OBUs); (b) non-financial corporations, which refer to public and private corporations and quasi-corporations, whose principal activity is the production of market goods or non-financial services.
5 And (c) households and non-profit institutions serving households (NPISHs). Current Account Current account The current account posted a deficit of US$614 million in Q1 2021, a reverses to a reversal from the US$225 million surplus recorded in the same deficit. quarter in the previous year. This developed on account of the widening of the trade in goods deficit coupled with the drop in net receipts recorded in the primary income account. v Trade in Goods2. Trade gap The trade in goods deficit increased by percent to US$ billion in widens. the first quarter of 2021 from US$ billion in the same quarter last year. This development reflected the sustained recovery momentum of the trade sector after hitting a trough in Q2 2020, owing to the strict containment measures imposed by the government at the onset of the COVID-19 pandemic in the Philippines.
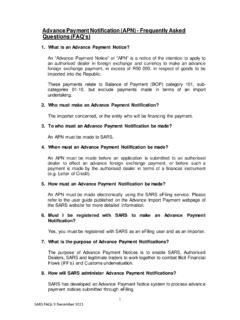
6 V Exports of Goods Exports of Exports of goods increased by percent to US$ billion in the first goods register quarter of 2021, on account mainly of stronger external demand from double-digit the Philippines' largest export markets, most notably China and the expansion. United States. During the first quarter of 2021, China posted a double-digit year-on-year domestic output growth, while the US. growth rebounded to the positive territory after being in a recession from Q2 2020 to Q4 2020. Figure 2. Exports by Major Commodity Group Percent Share Q1 2021. 2. Based on the BPM6 concept, trade in goods is computed using data from the Philippine Statistics Authority's (PSA) International Merchandise Trade Statistics, excluding the goods that did not involve change in ownership such as 1) consigned goods, 2) returned/replacement goods, and 3) temporarily imported/exported goods.
7 Department of Economic Statistics 2. On a by commodity basis, the improvement in trade in goods exports was buoyed by manufactures, which rose by percent to US$ billion in Q1 2021. Electronic products accounted for the bulk of the growth in the exports of manufactured goods, as shipments rose by percent, owing mainly to increased external demand for semiconductors and electronic data processing units. Other commodity groups that showed improvement during the period were coconut, forest, other agro-based, and sugar products. Meanwhile, exports of other commodity groups such as fruits and vegetables, petroleum, and mineral products were on the downtrend. v Imports of Goods Imports of Imports of goods during the first quarter of 2021 amounted to goods continue US$24 billion, 10 percent higher than the US$ billion recorded in its uptrend.
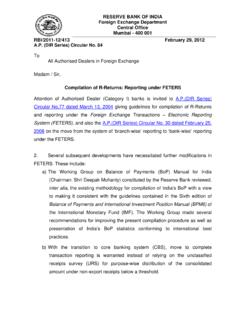
8 The same period in the previous year. This stemmed from stronger domestic demand for raw materials and intermediate goods, and capital goods, which posted double-digit year-on-year growth rates of percent and perccent, respectively, in the first quarter of 2021. In particular, telecommunications equipment and electrical machineries rose by 50 percent during the quarter, reflecting service providers' continuous efforts to improve their services in response to the stronger market demand for higher quality internet services. Likewise, manufactured goods, which increased by percent to US$ billion, and chemical products, which posted an percent growth to US$ billion in the same period, also supported the expansion in total imports.
9 Similarly, consumer goods increased by percent to US$ billion on account of the growth recorded in food and live animals ( percent), and other durable miscellaneous manufactures ( percent). Meanwhile, mineral fuels and lubricant dropped by percent to US$ billion during the quarter, reflecting subdued demand for such imports. Figure 3. Imports by Major Commodity Group Percent Share Q1 2021. Department of Economic Statistics 3. v Trade in Services Trade in services Net receipts of trade in services increased by percent to post higher net US$ billion in Q1 2021 from US$ billion in Q1 2020 as services receipts. imports posted a larger drop than services exports. Total PAYMENTS for services imports contracted by percent to US$ billion in Q1 2021 from US$ billion in Q1 2020.
10 Meanwhile, total receipts from services exports declined by percent to US$ billion from US$9 billion. The downtrend in services imports was due primarily to the declines recorded in travel ( percent), passenger transport ( percent), and charges for the use of intellectual property, ( percent). This was mitigated partly by the improvements registered in telecommunication ( percent), insurance and pension ( percent), computer ( percent), and other personal, cultural, and recreational ( percent) services imports. Meanwhile, the shortfall in services exports was on account of the decreases recorded in travel ( percent), passenger transport ( percent) and computer ( percent) services. It may be noted that the tourism industry is one of the sectors most severely affected by the pandemic following the lockdown measures and travel restrictions, which resulted in the substantial decrease in tourism export revenues.