Transcription of Balanced Scorecard and the Project Manager - IT Today
1 11 Chapter Balanced Scorecard and the Project ManagerA study of 179 Project managers and Project management office managers found that although most organizations understood the importance of effective Project management, they simply do not do a good job of managing their proj-ect management (PM) process. This translates to Project outcomes less stellar than are many different stakeholder groups involved in a typical Project ( , business process users, owners, users, business managers, clients, etc.) so it is under-standable that each of these stakeholder groups has different goals and objectives for assessing Project outcomes. At the most basic level, the triple constraint meth-odology (time, cost, quality) is most often used to assess Project success. However, many now believe that triple constraint does not account for the varied dimensions of projects that need to be considered in their assessments.
2 Current research in this area finds that there is a real lack of agreement on not only what constitutes Project success, but on methods for more comprehensive assessment of Project outcomes (Barclay, 2008).Given the varied dimensionality of a typical Project , some have argued that there needs to be a distinction between PM success, in terms of the traditional triple constraints of time, cost, and quality, and Project success, which is aligned with the product outcome of the Project , and discerned through the stakeholders. Thus, it is quite possible to experience product success, but not PM is by now obvious that the traditional Project measures of time, cost, and qual-ity need to be enhanced by adding some additional Project measurement dimen-sions, such as stakeholder benefits ( , customer satisfaction), product benefits Click here to buy Implementing the Project Management Balanced Scorecard2 Implementing the Project Management Balanced Scorecard (competitive advantage, financial rewards), and preparing for the future ( , value, personal growth, etc.)
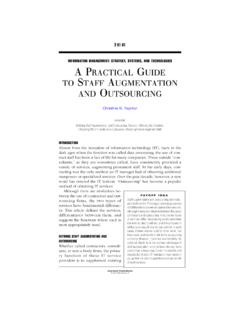
3 ; Barclay, 2008).Quite a few studies (Barclay, 2008; Lynn, 2006) suggest that an adaptation of the Balanced Scorecard business approach to performance management measure-ment provides just this sort of vehicle. Robert S. Kaplan and David P. Norton developed the Balanced Scorecard approach in the early 1990s to compensate for shortcomings they perceived in using only financial metrics to judge corporate performance. They recognized that in this new economy it was also necessary to value intangible assets. Because of this, they urged companies to measure such esoteric factors as quality and customer satisfaction. By the middle 1990s, Balanced Scorecard became the hallmark of a well-run company. Kaplan and Norton often compare their approach for managing a company to that of pilots viewing assorted instrument panels in an airplane cockpit: both have a need to monitor multiple aspects of their working the Scorecard scenario, as shown in Figure , a company organizes its business goals into discrete, all-encompassing perspectives: Financial, Customer, Internal Process, and Learning/Growth.
4 The company then determines cause effect relationships: for example, satisfied customers buy more goods, which increases rev-enue. Next, the company lists measures for each goal, pinpoints targets, and identi-fies projects and other initiatives to help reach those create scorecards tied to the company s targets, and employees and projects have scorecards tied to their department s targets. This cascading nature provides a line of sight among the individuals, the projects they are working How do we look to sh areholders?Fi nancialObjectivesMeasuresTargetsInitiati vesVision & StrategyHow can we sustain our ability to change and improve?Learning & GrowthObjectivesMeasuresTargetsInitiativ esHow do customers see us ?CustomerObjectivesMeasuresTargetsInitia tivesWhat must we excel at?Internal Business ProcessesObjectivesMeasuresTargetsInitia tivesFigure The Balanced here to buy Implementing the Project Management Balanced ScorecardBalanced Scorecard and the Project Manager 3on, the units they support, and how that affects the strategy of the enterprise as a Project managers, the Balanced Scorecard is an invaluable tool that permits the Project Manager to link a Project to the business side of the organization using a cause and effect approach.
5 Some have likened Balanced Scorecard to a new language, which enables the Project Manager and business line managers to think together about what can be done to support or improve business beneficial side effect of the use of the Balanced Scorecard is that, when all measures are reported, one can calculate the strength of relations among the vari-ous value drivers. For example, if the relation between high implementation costs and high profit levels is consistently weak, it can be inferred that the Project , as implemented, does not sufficiently contribute to results as expressed by the other ( , financial) performance first chapter examines the fundamentals of Balanced Scorecard as it relates to the precepts of Project management. Balanced Scorecard is examined in relationship to the organization and the people, processes, technologies, and products that are com-ponents of the organization s discrete projects, programs, and collaborative the Balanced ScorecardKaplan and Norton (2001) provide a good overview of how a typical company adapts to the Balanced Scorecard approach:Each organization we studied did it a different way, but you could see that, first, they all had strong leadership from the top.
6 Second, they translated their strategy into a Balanced Scorecard . Third, they cascaded the high-level strategy down to the operating business units and the support departments. Fourth, they were able to make strategy every-body s everyday job, and to reinforce that by setting up personal goals and objectives and then linking variable compensation to the achieve-ment of those target objectives. Finally, they integrated the Balanced Scorecard into the organization s processes, built it into the planning and budgeting process, and developed new reporting frameworks as well as a new structure for the management key, then, is to develop a Scorecard that naturally builds in cause-and-effect relationships, includes sufficient performance drivers, and, finally, provides a link-age to appropriate measures, as shown in Table the very lowest level, a discrete Project can also be evaluated using Balanced Scorecard .
7 The key here is the connectivity between the Project and the objectives of the organization as a whole, as shown in Table here to buy Implementing the Project Management Balanced Scorecard4 Implementing the Project Management Balanced ScorecardTable Typical Departmental Sample ScorecardObjectiveMeasure/MetricsEnd of FY 2010 (Projected)FinancialLong-term corporate profitabilityPercentage change in stock price attributable toEarnings growth+25 percent per year for next 10 years+20 percent per year for next 10 yearsShort-term corporate profitability1. New products2. Enhance existing products3. Expand client-base4. Improve efficiency and cost-effectivenessRevenue growthPercentage cost reduction+20 percent related revenue growthCut departmental costs by 35 percentCustomerCustomer satisfaction1. Customer-focused products2.
8 Improve response time3. Improve securityQuarterly and annual customer surveys, satisfaction indexSatisfaction ratio based on customer surveys+35 percent, raise satisfaction level from current 60 to 95 percent +20 percentCustomer retentionPercentage of customer attrition 7 percent, reduce from current 12 to 5 percentCustomer acquisitionPercentage of increase in number of customers+10 percentInternalComplete M&A transitional processesPercentage of work completed100 percentEstablish connectivityPercentage of workforce full access to corporate resources100 percentClick here to buy Implementing the Project Management Balanced ScorecardBalanced Scorecard and the Project Manager 5 Table Typical Departmental Sample Scorecard (Continued)ObjectiveMeasure/MetricsEnd of FY 2010 (Projected)Improve qualityPercentage saved on reduced work+35 percentEliminate errors and system failuresPercentage reduction of customer complaintsPercentage saved on better quality+25 percent+25 percentIncrease ROIP ercentage increase in ROI+20 40 percentReduce TCOP ercentage reduction of TCO 10 20 percentIncrease productivityPercentage increase in customer ordersPercentage increase in production/employee+25 percent+15 percentProduct and services enhancementsNumber of new products and services introduced5 new productsImprove response timeAverage number of hours to respond to customer 20 minutes.
9 Reduce from current level of 30 60 minutes to only 10 minutes or lessLearning and innovationsDevelopment of skillsPercentage amount spent on trainingPercentage staff with professional certificates+10 percent+20 percentLeadership development and trainingNumber of staff attending colleges18 Innovative productsPercentage increase in revenue+20 percent(continued)Click here to buy Implementing the Project Management Balanced Scorecard6 Implementing the Project Management Balanced ScorecardTable A Simple Project Scorecard ApproachPerspectiveGoalsCustomerFulfill Project requirementsControl cost of the projectSatisfy Project end usersFinancialProvide business value ( , ROI, ROA, etc.) Project contributing to organization as a wholeInternal processesAdhere to triple constraint: time, cost, qualityLearning and growthMaintain currencyAnticipate changesAcquire skillsetsTable Typical Departmental Sample Scorecard (Continued)ObjectiveMeasure/MetricsEnd of FY 2010 (Projected)
10 Improved processNumber of new products+5R&DPercentage decrease in failure, complaints 10 percentPerformance measurementPercentage increase in customer satisfaction, survey resultsPercentage projects to pass ROI testPercentage staff receiving bonuses on performance enhancementPercentage increase in documentation+20 percent+25 percent+25 percent+20 percentClick here to buy Implementing the Project Management Balanced ScorecardBalanced Scorecard and the Project Manager 7 The internal processes perspective maps neatly to the traditional triple con-straint of Project management, using many of the same measures traditionally used (as discussed in this book). For example, we can articulate the quality constraint using the ISO 10006:2003 standard. This standard provides guidance on the appli-cation of quality management in projects.