Transcription of Banana Market Review and Banana Statistics 2012-2013
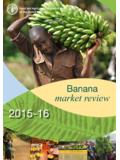
1 BANANAMARKET REVIEWandBANANASTATISTICS2012-2013 Intergovernmental Group on Bananas and Tropical FruitsBanana Market ReviewandBanana Statistics 2012 -2013 Market and Policy Analyses of Raw Materials, Horticulture and Tropical (RAMHOT) Products TeamFOOD AND AGRICULTURE ORGANIZATION OF THE UNITED NATIONSRome, 2014 The designations employed and the presentation of material in this information product do not imply the expression of any opinion whatsoever on the part of the Food and Agriculture Organization of the United Nations (FAO) concerning the legal or development status of any country, territory, city or area or of its authorities, or concerning the delimitation of its frontiers or boundaries.
2 The mention of specific companies or products of manufacturers, whether or not these have been patented, does not imply that these have been endorsed or recommended by FAO in preference to others of a similar nature that are not views expressed in this information product are those of the author(s) and do not necessarily reflect the views or policies of encourages the use, reproduction and dissemination of material in this information product. Except where otherwise indicated, material may be copied, downloaded and printed for private study, research and teaching purposes, or for use in non-commercial products or services, provided that appropriate acknowledgement of FAO as the source and copyright holder is given and that FAO s endorsement of users views, products or services is not implied in any requests for translation and adaptation rights, and for resale and other commercial use rights should be made via or addressed to information products are available on the FAO website ( ) and can be purchased through FAO 2014 Cover photographs: FAO/Simon Maina FAO/Antonello ProtoiiiContentsFOREWORD ivBANANA Market Review 2012 -2013 1 - 101.
3 Developments in Banana trade Exports Imports2. Banana prices Import prices Wholesale and retail prices3. Policy developments4. Current situation and short-term outlookSTATISTICAL TABLES 11 - 33 Table 1 - World gross exports by countryTable 2 - World net imports by countryTable 3 - EC: Total supply of bananas and per capita supplyTable 4 - Per capita net imports by countryTable 5 - Exports by countries of destinationTable 6 - Gross Imports by countries of originTable 7 - Import prices in selected countries, monthlyTable 8 - Wholesalers selling prices in selected countries, monthlyTable 9 - Retail prices in selected countries, monthlyivforewordThis report is issued on an annual basis to Members and Observers of the Sub-Group on Bananas of the Intergovernmental Group on Bananas and Tropical Fruits.
4 It is prepared by the Market and Policy Analyses of Raw Materials, Horticulture and Tropical (RAMHOT) Products Team, Trade and Market Division, FAO, Rome, and the tables contained bring together the information available to FAO, supplemented by data obtained from other sources in particular with regard to preliminary estimates. The Market and Policy Analyses of Raw Materials, Horticulture and Tropical (RAMHOT) Products Team provides economic data and analyses on major agricultural raw materials and horticultural and tropical products. Commodities covered under the Team include, bananas and tropical fruits, citrus fruits, cotton, hides and skins, jute, kenaf and allied fibres, sugar, and tea.
5 The Team also undertakes Market reviews, outlook appraisals and projections, and provides assistance to developing countries in designing and implementing national policies for those agricultural commodities which enter into international report is available at the following FAO website: Market Review 2012 -20131. Developments in Banana tradeExportsIn 20121 the volume of global gross Banana exports reached a record high of million tonnes, million tonnes (or percent) above 2011 level. The increase is primarily explained by the growth of exports from Latin America and the Caribbean from to million tonnes, despite the poor performance of Ecuador. In Ecuador, the largest Banana exporter in the world, Banana exports shrank as flooding damaged the crop, reducing the output by 416 000 tonnes, or percent, relative to 2011.
6 The resulting 410 000 tonnes decline in shipments from Ecuador was more than offset by vigorous exports from other countries, in particular those in Central for 2012 show a remarkable shift from exports originating in South America towards greater exports from Central America and Mexico. While exports from South America declined by percent relative to 2011, Central America and Mexico expanded their combined export volumes by percent, possibly in anticipation of trade preferences for Central American bananas in the European Market as part of the Association Agreement. As a result, the average share of South America in global Banana exports has declined from percent in 2007-2011 to percent in 2012 , while the share of Central America and Mexico increased from percent to Rica s export quantity reached million tonnes in 2012 , 126 000 tonnes higher than in 2011, overtaking Colombia as the second most important exporter in Latin America.
7 In 2012 Banana exports from Colombia dropped by percent, from in 2011 to million tonnes, mainly due to the spread of Moko disease. Guatemala s exports have also surpassed those of Colombia, standing at million tonnes in 2012 - an increase of percent (362 000 tonnes) compared to 2011. In Honduras, export volumes marked an astonishing 75 percent growth between 2011 and 2012 , reaching a record 901 000 tonnes in 2012 or double the 2003 exports. Mexico also registered an important increase in shipments, from 178 000 tonnes in 2011 to 308 000 tonnes in 2012 . Peru is another dynamic exporter, which had almost no exports prior to 2000 and reached 124 000 tonnes in 2012 , or percent above shipments made in 2011, most of which were fair trade and organic bananas grown by smallholder the Caribbean, exports continued to be dominated by the Dominican Republic, which, apart from Belize, is the only country among the Caribbean ACP countries 1 Provisional data received from the countries and complemented with UN Comtrade bananas continue to be a major export despite the preference erosion in the European Union (EU) Market , thanks to the strong focus on organic and fair trade bananas.
8 Nevertheless, following a period of dynamic growth from 2000 to 2011, in 2012 Dominican Banana exports declined by percent to 297 000 tonnes. Other Caribbean countries have maintained very low volumes of exports, continuing the declining trend of recent years. Jamaica s exports have virtually disappeared since 2008, and all production is now directed to the domestic Market . Exports from other Caribbean countries excluding Dominican Republic have also registered a steady decline as a result of a combination of preference erosion on exports to the EU and climatic disasters that have severely undermined production. The combined exports from the Caribbean other than Dominican Republic plummeted from 88 000 tonnes in 2009 to 21 000 tonnes in 2011.
9 In 2012 a slight recovery is estimated to take place, reflecting primarily an expansion in exports from Saint Lucia from 6 200 tonnes to 12 100 from Asia showed a remarkable recovery: After substantial declines in exports between 2006 and 2010, which were driven by shrinking exports from the Philippines, the volume of exports from the region rose percent in 2011 and percent in 2012 , reaching almost million tonnes, well above the previous record of million tonnes in 2006. Because of this recovery, the Philippines returned to being the second largest exporter of bananas in the world after Ecuador. With the remarkable growth rates in both 2011 and 2012 , the Philippines reached the peak of its export performance in 2012 at million tonnes, corresponding to percent of all exports from f r i c a s exports, which accounted for percent of global Banana shipments, grew by percent in 2012 as exports reached 649 000 tonnes.
10 C te d Ivoire, the largest exporter in the region, shipped 339 000 tonnes of bananas in 2012 , or percent more than in 2011, while exports from Cameroon, the second largest African exporter, declined by per cent to 246 000 tonnes. Figure 1 Banana exports by region 2008- 2012 , million 2009 2010 2011 2012 AfricaAsiaLatin Americaand Caribbean3 ImportsThe United States and EC-27 each imported approximately 27 percent of all bananas traded internationally in 2012 , while other importers operated at a much smaller scale. After a record high of almost million tonnes of bananas imported by Russia in 2011, when purchases grew by percent, those in 2012 declined by percent to approximately million tonnes. A similar situation is observed in China: After a rapid expansion of Banana imports over the past four years, they declined from the record high of 910 000 tonnes in 2011 to 716 000 tonnes in 2012 , corresponding to a percent drop, mostly due to the increase in domestic production.
