Transcription of Basic Facts About Low-Income Children
1 April 2021 National Center for Children in PovertyBank Street Graduate School of Educa onBasic Facts About Low-Income ChildrenCHILDREN UNDER 18 YEARS, 2019 Heather Koball, Akilah Moore, and Jennifer | 1 National Center for Children in PovertyAmong all Children under 18 years in the US, 38 percent live in Low-Income families and 17 percent approximately one in five are poor. This means that Children are overrepresented among our nation s poor; they represent 23 percent of the population but comprise 32 percent of all people in poverty . Many more Children live in families with incomes just above the poverty a child in a Low-Income or poor family does not happen by chance. Parental education and employment, race/ethnicity, and other factors are associated with Children s experiences of economic insecurity.
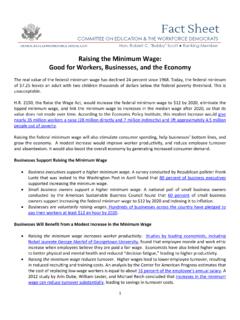
2 This fact sheet highlights disparities in Children s experiences of economic insecurity by race, geography, and other is the 2019 federal poverty threshold (FPT)?2 $25,926 for a family of four with two Children $20,578 for a family of three with one child $17,622 for a family of two with one child Is a poverty -level income enough to support a family? Research suggests that, on average, families need an income equal to About two times the federal poverty threshold to meet their most Basic Families with incomes below this level are referred to as low income: $51,852 for a family of four with two Children $41,156 for a family of three with one child $35,244 for a family of two with one child These dollar amounts approximate the average minimum income families need to make ends meet, but actual expenses vary greatly by | 2 National Center for Children in PovertyHow many Children under age 18 years live in Low-Income families in the United States?
3 There are more than 27 million Children under age 18 years who live in Low-Income families in the United States. 38 percent of those Children live in Low-Income the percentage of Children living in low-incomeand poor families changed over time?The percentage of Low-Income Children (both poor and near poor) decreased from 45 percent in 2010 to 38 percent in 2019, and has decreased from a high of 46 percent in 2012 (Figure 2).Between 2010 and 2019, the overall number of Children ( Children under age 18) decreased from million to million. The number of Low-Income Children decreased from million to million, the number of poor, Children decreased from million to million, and the number of Children living in deep poverty , defined as less than 50 percent of the federal poverty threshold, decreased from million to million (Table 1).
4 Figure 1: Children by Family Income, 2019 Above low income 62%Poor 17%Near Poor21%Low income 38%Note: Above low income is defined as at or above 200 percent of the federal poverty threshold (FPT), poor is defined as below 100 percent of FPT, and near poor is between 100 percent and 199 percent of the FPT. The Low-Income category includes both the poor and the near 2: Children Living in Low-Income and Poor Families, 2010 201950403020100 10 11 12 13 14 15 16 17 18 19 Near poor 100 200% FPL Poor50 100% FPLDeep poverty Less than 50% FPLP ercent (%)20102019 Low income33,216,70127,149,328 Poor16,810,05311,899,951 Deep poverty8,139,8975,246,089 Table 1: Number of Children Living in Low-Income and Poor Families, 2010 | 3 National Center for Children in PovertyHow does the poverty status of Children compare to the rest of the population?
5 The percentage of Children in Low-Income families surpasses that of adults. In addition, Children are About twice as likely as adults 65 years and older to live in poor families (Figure 3).Does the percentage of Children in Low-Income families vary by age group?Younger Children are more likely to live in deep-poor, poor, or Low-Income families (Figure 4).Does the percentage of Children in Low-Income families vary by race/ethnicity?4As Figure 5 illustrates, the percentages of Low-Income and poor Children varies by race and ethnicity. Latino and White Children comprise the same share of Children living in Low-Income families (36 and 35 percent, respectively). Latinos comprise the largest share of Children living in poor families in this age group (36 percent).5 However, Black, Native American , and Latino Children are disproportionately low income and poor.
6 Further, Black and Native American Children are over three times as likely to experience deep poverty compared to White Children (Figure 6).Figure 3: Family Income by Age, 2019 Figure 4: Percentage of Children in Low-Income and Poor Families by Age, 2019403020100 Percent (%)Low incomePoorDeep povertyUnder 3 Ages 3-5 Ages 6-1140% mil18% mil9%933,14840% mil8%931,45139% mil17%4 mil7% milPoorNear poorAbove low incomeLess than age 18 Ages 18 to 64 Ages 65+Low income38%Low income26%Low income27%17%21%62%11%15%74%9%17%73%Figur e 5: Race/Ethnicity Among Children by Family Income, 2019 Percentages may not add up to 100 due to roundingPercent (%)100806040200 TotalLow incomeLow incomePoor50%13%26%35%20%36%30%24%36%5%5 %1%5%5%1%3%5%1%Non-Latino WhiteNon-Latino BlackLatinoAsianNative American OtherAges 12 1718%2 mil35% mil15% mil6% | 4 National Center for Children in PovertyDoes the percentage of Children in Low-Income families differ by their parents immigration status?
7 6 Children of immigrants are more likely to be Low-Income than Children of US-born parents (Figure 7). What are the family characteristics of Low-Income and poor Children ?PARENT EMPLOYMENT6 Children with a full-time, year-round employed parent are less likely to live in a Low-Income family compared to Children with parents who work part time/part year or who are not employed (Figure 8). Nevertheless, many Low-Income and poor Children have parents who work full time. About 57 percent of Low-Income Children and 36 percent of poor Children live with at least one parent who is employed full time, year round (Figure 9).45% million Children with immigrant parents live in Low-Income million Children withUS-bornparents livein 7: Percentage of Children in Low-Income Families by Parents Immigration Status, 2019 Figure 6: Percentage of Children in Low-Income and Poor Families by Race/Ethnicity, 2019 Percent (%)Low incomePoorDeep poverty80706050403020100 WhiteBlackLatinoAsianNativeAmericanOther 26%10%4%58%30%14%53%23%10%25%9%3%55%31%1 5%36%16%7%Figure 8: Percentage of Children in Low-Income and Poor Families by Parent Employment, 2019806040200 Percent (%)Low incomePoorFull time, year roundPart time or part yearNot employed28%7%68%41%83%65% | 5 National Center for Children in PovertyFigure 10.
8 Percentage of Children in Low-Income and Poor Families by Parent Education, 201980604020077%44%62%28%26%10%Less than high school degreeHigh school degreeSome college or morePercent (%)Low incomePoorPARENT EDUCATION7 Higher levels of parental education decrease the likelihood that a child will live in a Low-Income or poor family. Among Children with at least one parent with some college or additional education, 26 percent live in Low-Income families and 10 percent live in poor families. By contrast, among Children in this age group whose parents have less than a high school degree, 77 percent live in Low-Income and 44 percent live in poor families (Figure 10). At the same time, significant shares of Low-Income and poor families with Children are headed by parents with at least some college education, as shown in Figure 11: Parent Education Among Children by Family Income, 2019 Some college or moreHigh school degreeLess than high school degreeLow incomePoor51%32%17%43%33%24%Figure 9: Parent Employment Among Children by Family Income, 2019 Full Time/Full YearPart Time/Part YearNot Employed57%27%17%37%29%36%Low | 6 National Center for Children in PovertyDoes the percentage of Children in Low-Income families vary by where they live?
9 REGIONThe percentage of Low-Income Children varies substantially by region (Figure 12).RESIDENTIAL INSTABILITY AND HOME OWNERSHIPR esearch suggests that stable housing is important for healthy child However, Children living in Low-Income families are more likely than other Children to have moved in the past year and to live with families who rent, rather than own, their homes (Figure 13).HOUSING AND ENERGY INSECURITY 9A much larger percent of Low-Income Children experience housing and energy insecurity (Figure 14). Housing and energy insecurity means that their families have difficulty paying these expenses each month, leading to additional stress in the 13: Residential Instability and Home Ownership by Family Income, Families With Children , 201963%17%22%11%Rent housingMoved within one yearLow incomeAbove low incomeFigure 14: Housing and Energy Insecurity by Family Income, Families With Children , 2019 Energy insecurityHousing insecurityLow incomeAbove low income51%46%6%4%Figure 12: Percentage of Children in Low-Income Families by Region, million36% million33% million42% million36% | 7 National Center for Children in Poverty86420 What proportion of Low-Income Children are covered by health insurance?
10 10 Among Children under age 18, 7 percent of Low-Income Children and 7 percent of poor Children are Public insurance programs cover 38 percent of Children , a slight increase since 2010 (Figure 16). They reach many more economically disadvantaged Children than private plans, covering 72 percent of Low-Income Children and 82 percent of poor proportion of Children in Low-Income families receive support from the Supplemental Nutrition Assistance Program (SNAP)?Among Low-Income Children under age 18, less than half (42 percent) receive SNAP benefits (Figure 17). This percentage is lower than the 51 percent of Children who received SNAP benefits in 2010, but represents a significant decline from the 55 percent of Children who received SNAP benefits in 2012 and 16: Type of Health Insurance Coverage Among Children by Family Income, 2010 & 2019100806040200 Private insurancePublic insuranceNo insurancePercent (%)All children201020192010201920102019 Low-Income childrenPoor children57%35%8%57%38%5%23%65%12%21%72%7 %11%78%11%11%82%7%Figure 17: Low-Income Children Who Receive Support From the Supplemental Nutrition Assistance Program, 201959%42%PoorLow incomeFigure 15.