Transcription of Basic NMR Concepts - Boston University
1 BU-CIC-12-041 Basic NMR Concepts :A Guide for the Modern LaboratoryDescription:This handout is designed to furnish you with a Basic understanding of Nuclear MagneticResonance (NMR) Spectroscopy. The Concepts implicit and fundamental to the operationof a modern NMR spectrometer, with generic illustrations where appropriate, will bedescribed. It can be read without having to be in front of the spectrometer itself. Somebasic understanding of NMR spectroscopy is of Contents: Basic NMR IntroductionII. basics of FT-NMR: Six critical Applications of FT-NMR1) Shimming, line widths, and line shapes2) Signal-to-noise measurements3) Integration4) Homonuclear decoupling5) 13C-{1H} spectra6) 13C-{1H} DEPT spectraBU-CIC-12-042 IntroductionNuclear Magnetic Resonance (NMR) is a powerful relatively non-selectiveanalytical tool, which enables you to ascertain molecular structure including relativeconfiguration, relative and absolute concentrations, and even intermolecular challenging and specialized NMR techniques have become routine.
2 NMR is indeedan indispensable tool for the modern scientist. Chemists, with little knowledge of NMR,are now able to obtain 2- or even 3-dimensional spectra with a few clicks of a must be taken, however, when using such black box approaches. While thestandard parameters used in the set-up macros for experiments might be adequate for onesample, NMR system, or hardware configuration, they may be very wrong for another. Asingle incorrectly set parameter can mean the difference between getting an accurate,realistic spectrum and getting a meaningless result, or even worse, damaging equipmentthat often costs several hundreds of thousands of dollars. A Basic understanding of a fewkey aspects of NMR spectroscopy can ensure that you obtain the best results guide is intended to highlight the most pertinent aspects of practical NMRspectroscopy. It is not meant to replace any formal training of the theory of NMR.
3 "Modern pulse NMR is performed exclusively in the Fourier Transform mode. Ofcourse it is useful to appreciate the advantages of the transform, and particularly thespectacular results that can be achieved by applying it in more than one dimension, but itis also essential to understand the limitations imposed by digital signal analysis. Thesampling of signals, and their manipulation by computer, often limit the accuracy ofvarious measurements of frequency and amplitude, and may even prevent the detection ofsignals altogether in certain cases. These are not difficult matters to understand, but theyoften seem rather abstract to newcomers to FT NMR. Even if you do not intend to operatea spectrometer, it is irresponsible not to acquire some familiarity with the interactionbetween parameters such as acquisition time and resolution, or repetition rate,relaxation times and signal intensity. Many errors in the use of modern NMR arisebecause of a lack of understanding of its limitations.
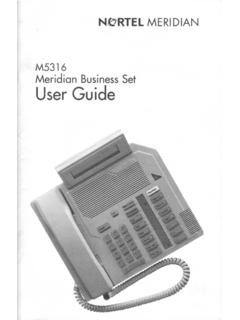
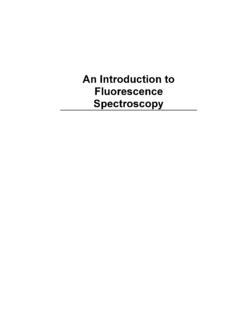
4 "From Derome, Modem NMR Techniques for Chemistry Research (1987) basics of FT NMR- Six Critical ParametersThis section will give you enough information about FT-NMR experiments toavoid the most common errors. We will cover the most important parameters that affectany spectrum you may collect using an FT-NMR spectrometer. These are:1. Spectrometer frequency [sfrq]2. Pulse Width [pw]3. Acquisition Time [at]BU-CIC-12-0434. Number of Points [np]5. Sweep Width [sw]6. Recycle Delay [d1][The blue letters in square brackets following the parameter represent the mnemonic used(the command), on all Varian spectrometers in the VNMR software package. Theparameters are discussed in more detail below.]The most Basic and common pulse sequence you will encounter is the 1-PULSE FT-NMR experiment ( seqfil = s2pul in VNMR), which is the sequence used forroutine 1H and 13C acquisitions. It can be represented as shown in Figure 1.
5 In a typicalNMR acquisition, this pulse sequence will be repeated many times in order to improvethe signal-to-noise ratio (S/N), which increases with the square root of the number oftransients that are averaged together (nt). The user can independently set each of theparameters shown in Figure 1. Knowledge of their purpose and function will help youobtain quality NMR spectra. On Varian spectrometers, you can view the current pulsesequence by typing dps .Pulse Width (pw) Recycle Delay (d1) Acquisition Time (at)Figure 1. Schematic representation of one pass of a simple 1-PULSE pulse Spectrometer frequency [sfrq]:It is called a 1-PULSE experiment because one radio frequency (Rf) pulse (pw)is applied per cycle. The Rf pulse excites the nuclei, which then emit Rf during theacquisition time, giving rise to an NMR signal in the form of an exponentially decayingsine wave, termed free-induction decay (FID).
6 The Rf pulse has a characteristicfrequency, called the spectrometer frequency (sfrq), which is dependent upon the nucleusyou wish to observe and the magnetic field strength of the spectrometer. NMRspectrometers are generally named for the frequency at which hydrogen atoms , a Varian INOVA 500 will cause hydrogen atoms to resonate at approximately 500 MHz. The precise spectrometer frequency defines the exact center of the NMR spectrumyou Rf pulse that excites spins at only one exact frequency is not desirable becausethe NMR frequencies are spread out over a range of frequencies called the range ofchemical shifts (corresponding to ~10 ppm of the applied magnetic field for 1H and ~250BU-CIC-12-044ppm for 13C). Luckily, the short pulse lengths used in FT-NMR ( ~10 s) causes theRf power to be distributed over a corresponding frequency spread (~1/pw, or 1 = ~100,000 Hz) due to the Heisenberg Uncertainty Principle.
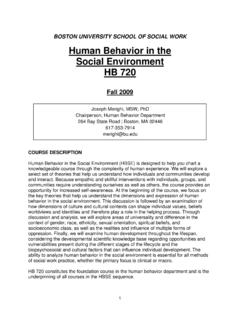
7 As you shorten thepulse length and increase power, uncertainty in the frequency results in a larger field ofexcitation ( frequency range of power deposition). A longer, lower power pulse will haveless frequency spread and can be used for frequency selective excitation or Pulse width [pw]:Prior to applying an Rf pulse, the majority of nuclear spins are aligned parallel tothe static magnetic field (B0). The axis of alignment is typically designated the Z-axisand the bulk magnetization is shown as a bold arrow (Figure 2, left side). Application ofa short Rf pulse at the appropriate frequency will rotate the bulk magnetization by aspecific angle. Pulses are generally described by this angle of rotation (also called flipangle). The angle of rotation is dependent on the intensity of the pulse (tpwr) and thewidth of the pulse (pw). The maximum measurable signal can be recorded following a90 rotation or pulse.
8 Thus, a 90 pulse width is defined as the amount of time the pulseof Rf energy is applied to the particular sample (90 is not 90 for all samples!) in order toflip the bulk magnetization from the Z-axis precisely into the X-Y plane, , thecondition shown in Figure 2A. For example, the 90 pulse width for 1H NMRexperiments might be about 8 s on the Varian Inova 500. It is often very useful to talkabout the strength of the oscillating magnetic field associated with the Rf pulse in termsof the rotation frequency (rather than the time required to rotate the bulk magentization90 ). For example, if it takes 8 s to rotate 90 , then using the same Rf intensity it willtake 4*8 s = 32 s to rotate 360 . The intensity of the Rf field can then be described as amagnetic field that causes the magnetization to rotate at a rate of 1/32 s, or at 31,250 Hz( KHz). We call this magnetic field the B1 field, analogous to our description of themain static magnetic field (B0).
9 (Note: a 300, 400, or 500 MHz static B0 field is roughly10,000-20,000 times stronger than a typical oscillating B1 field that comes from the Rfpulse). The importance of learning this convention will become strongly apparent whenyou setup a homonuclear decoupling or nOe experiments, or perhaps a two-dimensionalTOCSY pulse width is entered in microseconds by typing pw=desired value inmicroseconds. The exact value is dependent upon the sample (nucleus, solvent, etc.) aswell as the instrument (probe, etc.). Methods for measuring the pulse width will bediscussed in another handout and are, for the most part, not required until you attemptadvanced experiments. For routine one-dimensional survey experiments, most users use a25 - 45 pulse for their data collection (Figure 2B). The reasons for this are discussedunder recycle delay (d1).BU-CIC-12-045 ZYXB0PW= 10 s (900)ZYX900A)YXB0 XYZPW= 5 s (450)Z450B)Figure 2.
10 The bulk nuclear spin magnetization (bold arrow) for an NMR sample placedin a magnetic field aligned along the Z-axis before and after application of a Acquisition time (at):Thus far, we have sent an Rf pulse through the sample and flipped the bulkmagnetization by a specific angle. The nuclear spins are no longer at equilibrium andwill eventually return to equilibrium along the Z-axis. One of the most extraordinaryaspects of NMR is that the relaxation back to equilibrium takes from 106-1012 timeslonger than many other spectroscopies that you routinely utilize! In Figure 1, thedecaying sine wave represents this process of Free Induction Decay (FID), which is a plotof emitted radio intensity as a function of time. The time it takes to acquire the FID iscalled the acquisition time and is set by the parameter at . For most nuclei of interest tochemists, relaxation times are within the range of 10-1 to 10 seconds.