Transcription of Basic Statistics: A Review - Statistical Design Methods
1 Basic statistics Refresher Mense Basic statistics : A Review by Allan T. Mense, , PE, CRE. This is not a textbook on statistics . This is a refresher that presumes the reader has had some statistics background. There are some easy parts and there are some hard parts. The most useful references used to put this material together were: 1) Engineering statistics by Montgomery, Runger and Hubele, 4rd Edition, John Wiley & Sons, 2007. An excellent introduction to statistics for engineers. 2) Statistical Models in Engineering by Hahn & Shapiro, Wiley Classics Library, 1994. (Paperback). 3) Introduction to Error Analysis by John R. Taylor ( Mister Wizard ) University Science Books, Sausalito, CA, 1997. 4) Quality Engineering statistics , by Robert A.
2 Dovich, ASQ Quality Press, 1992. (paperback). The outline of topics as well as some examples used in this refresher was taken from this book by Dovich. 5) Practical Engineering statistics , by Schiff & D'Agostino, Wiley Interscience, 1991. An excellent small statistics book. Topics Covered: Topic 1 Point Estimates Topic 2 Distribution Functions Topic 3 Confidence Intervals Topic 4 Hypothesis Testing Topic 5 Testing for Differences in Variances Topic 6 Decision Errors, Type I and Type II. Appendix A Probability Distributions Appendix B Goodness of Fit. Appendix C Sampling by Variables Appendix D Linear Regression Appendix E Estimate of Expected Value and Variance for Nonlinear Functions Appendix F Basic concepts in Probability (some advanced material).
3 Appendix G Noncentral distributions (advanced). Topic 1 Point Estimates When working with data, typically a small sample from a large population of data, we wish to use this sample to estimate parameters of the overall population. The population may be finite or infinite. In describing a population we typically wish to know where the center resides, how much variation there is in the data about the central value, whether the distribution is symmetric or skewed to one side, and how peaked or flat it is. One possible set of point estimates for data would be the mean, variance, coefficient of skewness, and the coefficient of kurtosis. This is explored in the following sections. Measures of Central Tendency: There are three major measures of central tendency of a population; they are the mean, median and mode.
4 We find these parameters by calculating Statistical estimators for these parameters using sample data. Generally, we wish to have Statistical estimators that give the best unbiased estimates of these population parameters. The population mean is 1/78. Basic statistics Refresher Mense estimated from the simple arithmetic average of the sample data. If the number of data points in the sample is N the mean is calculated by 1 N. 1) x xi N i =1. where xi is the value of the ith data point in the sample of size N. This is the unbiased estimator of the population mean. The median of the population is estimated from the median of the sample data, which is the middle data point from a data sample that is sorted from smallest to largest values (see example below).
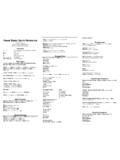
5 For N odd, it is the middle data point. For N even the median is the average of the middle two data points. The mode is simply the most probable value and is determined from the sample data by plotting the data (usually as a histogram) and determining the range of the x-values that most frequently occurs; the center of that range is called the mode. There can be more than one mode, called multi-moded, for a population. Example 1. Test data x value x1 33 Histogram of data x2 22 3 bins Range = 15. x3 35 lower upper midpoint frequency x4 27 21 26 2. x5 30 27 32 3. x6 26 33 38 4. x7 32 Histogram x8 34 5 mode x9 37 4. mean = 3. median = 32 2. mode = 1. The median is determined by sorting the data from smallest to largest values and counting to the middle ((N+1)/2) point.
6 Sorting the above data produces;. 22 26 27 30 32 33 34 35 37. The middle value is the (9+1)/2 =5th value in the sorted order which is the number 32. Thus, the median is the point for which 50% of the numbers are bigger than the median and 50% of the numbers are less than the median. If there are an even number of data points then the median is taken to be the average of the middle two data values. Creating a histogram of the data, as seen above, and finding the value that represents the most frequently occurring range of numbers determines the mode. For example, one easily sees there are more values that lay within the interval 33 to 38 than in the other 2/78. Basic statistics Refresher Mense intervals. We generally choose the midpoint of the interval to represent the value of the ordinate on the histogram.
7 In many samples of real data, there may not be just one peak value when the data is plotted in a histogram. In these multimodal cases, the mode may not be a useful or meaningful measure of central tendency. When we deal with symmetrical distributions of data such as are represented by a Gaussian or normal or bell-shaped distribution the mean = median = mode. Attribute data: When dealing with attribute data such as what fraction of M&Ms in a package are blue, we are interested in a ratio (# blue / total # in the package). These proportions are called attribute data. Another example would be fraction of nonconforming units which is used when screening units from a supplier. In this instance we would record p = number of nonconforming units / number of units tested.
8 For example if we only had 200 units in the population and all 200 units were tested and 4 failed then = 4/200 = .02 is the population fraction defective. Measures of Variation or Dispersion. The four useful measures of dispersion are 1) the variance 2, which is estimated from the sample data by the statistic s2, 2) the standard deviation , which is the square root of the variance, and is estimated by s (which is biased), 3) the range, R = largest sample value smallest sample value, and 4) the average of the absolute value of the residuals. By far the most used measures are the variance and the standard deviation. For a finite population of size N the variance is defined by 1 N. 2) 2 = ( xi ) 2. N i =1. 1 N. and is the mean of the population xi.
9 The standard deviation of the N i =1. population is found by taking the square root of the population variance. We seldom have the entire population of a variable to use for calculations so we must try and infer information about the population from taking one or more samples of data from the population of interest. When we only have a sample from the population, then the sample variance is defined by 1 n 3) s2 ( xi x )2 , n 1 i =1. where n is the size of the sample and x is the mean of the sample. The factor of n-1 is necessary to make sure that s2 is an unbiased estimator of the population variance. More will be said of biased and unbiased estimators in Appendix A. One usually wants unbiased estimators of population parameters.
10 The square root of s2 is not the unbiased estimator of but it is usually close enough. Excel has functions that calculate the mean and the population and sample variances and standard deviations. Mean = AVERAGE(range of cells containing data), population variance = VARP(range of cells), sample variance = VAR(range of cells), STDEVP(range of cells) = standard deviation of population, STDEV(range of cells) =. standard deviation of sample (biased). Equation 3) can be expanded into a more useful form for hand calculation. 3/78. Basic statistics Refresher Mense 1 n 2 1 N . 2. 4) s =. 2. xi xi . n 1 i =1 n i =1 . The expected value of s2, E[s2] is 2 and is an unbiased estimator of the population variance. The unbiased estimate of is not the sample statistic s = square root of the sample variance.