Transcription of Basic Statistics Formulas
1 Basic Statistics FormulasPopulation MeasuresMean =1n xi(1)Variance 2=1n (xi x)2(2)Standard Deviation = 1n (xi x)2(3)SamplingSample meanx=1n xi(4)Sample variances2x=1n 1 (xi x)2(5)Std. Deviationsx= 1n 1 (xi x)2(6)z-scorez=x (7)Correlationr=1n 1n i=1((xi x)sx)((yi y)sy)(8)Linear RegressionLine y=a+bx(9)b=rsysx,a=y bx(10)s= 1n 2n i=1(yi y)2(11)SEb=s n i=1(xi x)2(12)To testH0:b= 0,uset=bSEb(13)CI=b t SEb(14)ProbabilityP(AorB) =P(A) +P(B) P(AandB)(15)P(notA) = 1 P(A)(16)P(AandB) =P(A)P(B) (independent)(17)P(B|A) =P(AandB)/P(A)(18)0! = 1;n! = 1 2 3 (n 1) n(19)(nk)=n!k!(n k)!(20)Binomial Distribution :P(X=k) =(nk)pk(1 p)n k(21) =np, = np(1 p)(22)One-Sample z-statisticTo testH0: = 0usez=z 0 / n(23)Confidence Interval for =x z n(24)Margin of ErrorME=z n(25)Minimum sample sizen [z ME]2(26)One-Sample t-statisticSEM=sx n, t=x sx/ n(27)Confidence Interval =x t sx n(28)Two-Sample t-statistict=x1 x2 s21n1+s22n2(29)Conf.
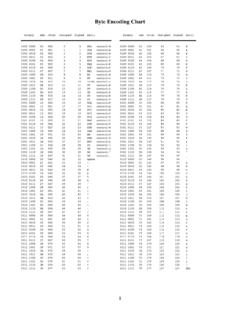
2 Interval = (x1 x2) t s21n1+s22n2(30)Sample Proportions p=p, p= p(1 p)n(31)Conf. Int. = p z (SE)(32)SE = p(1 p)n(33)sample sizen >[z ME]2p (1 p ) (34)To testH0:p=p0,usez= p p0 p0(1 p0)n(35)Two-Sample ProportionsSE= p1(1 p1)n1+ p2(1 p2)n2(36)CI= ( p1 p2) z (SE)(37)To testH0:p1=p2,use(38)z= p1 p2 p(1 p)(1n1+1n2)(39) p=X1+X2n1+n2, Xi= successes(40)Chi-Square Statistic 2=n i=1(oi ei)2ei(41)oi= observed,ei= expectedCentral Limit Theoremsx nasn (42) 2013 Shapiro. This work is licensed under aCreative Commons Attribution-NonCommercial-ShareAlike Unported License(BY-NC-SA ). details. Please address all corrections Last revised May 9, 2016. Original PDF and LATEX files available Normal Cumulative Proportions (below)TailArea1-C2 AreaCt-Distribution Critical Values (to right)Standard Normal Cumulative Cumulative ProportionsConfidence Level Cdf50%60%70%80%90%95%96%98%99% Distribution Critical ValuesProbabilityp


![INDEX [www.brammerstandard.com]](/cache/preview/2/3/d/d/5/6/b/f/thumb-23dd56bf2c5253e5b1625a9af4865fc1.jpg)