Transcription of BD Quantibrite™ Beads
1 Becton, Dickinson and CompanyBD Biosciences2350 Qume DriveSan Jose, CA 95131 Research Use Only. Not for use in diagnostic or therapeutic procedures. BD Quantibrite BeadsPE Fluorescence Quantitation KitFormCatalog numberPE340495 Product availability varies by region. Contact BD Biosciences Customer Support or your local sales representative for APPLICATIONSR esearch applications include studies of: Flow cytometric estimation of antibodies bound per cell (ABC)1,2 DESCRIPTIONEach BD Quantibrite PE tube contains a lyophilized pellet of Beads conjugated with four levels of phycoerythrin (PE). The pellet is restrained in the bottom of the tube by a stainless steel retainer. The number of PE molecules per bead at each level varies among lots; lot-specific information is included with each kit. Each BD Quantibrite tube contains gelatin and sodium azide and is packaged in a foil pouch. There are 10 tubes per kit. BD Quantibrite PE tubes are designed for use with PE-labeled monoclonal antibodies for the purpose of estimating ABCs by flow cytometry.
2 When you run a BD Quantibrite PE tube at the same instrument settings as the assay, the FL2 axis can be converted into the number of PE molecules bound per cell. By using known ratios of PE to antibodies, you can then convert PE molecules per cell to antibodies per cell. These factors, and others that affect quantitation, are discussed in detail in the BD Quantibrite white the BD Quantibrite PE tube from the foil pouch just prior to use, reconstitute using mL of buffer, such as phosphate buffered saline (PBS) with sodium azide plus bovine serum albumin (BSA), and cytometric analysis1. Launch BD CellQuest software . Using the setup mode, adjust all parameters for your cellular assay. Make sure the instrument is compensated properly, for example, with BD Calibrite Open the Quantitation Acquisition document, located in the Sample Files folder in the BD CellQuest folder (only in BD CellQuest and later versions). Modify the document to include plots for your cellular Run the BD Quantibrite PE tube, thresholding on FSC or SSC, and collect 10,000 events.
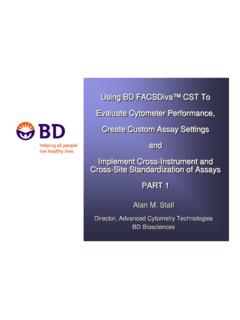
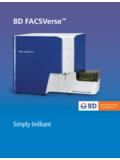
3 The FSC and SSC parameter settings can be changed to gate on bead singlets without altering quantitation (Figure 1). All instrument settings for fluorescence and compensation must be the same as the cellular assay 2 Figure 1 Bead singlets4. Adjust the gate around the bead singlets (Figure 1) on the FSC-H vs SSC-H plot. The singlet bead population is analyzed using a histogram plot of FL2-H in linear Adjust markers around the four bead peaks (Figure 2). View the histogram statistics (Figure 3), making sure that the geometric means are 2 Bead peaksFigure 3 Bead histogram statistics6. Select the Histogram Statistics view and choose Quantitative Calibration from the Acquire Click the Copy Means button to copy the geometric means of the four bead peaks from the histogram statistics Enter the lot-specific PE/bead values provided on the flyer packaged in the BD Quantibrite PE Press the tab key; then click Calibrate for BD CellQuest to perform the regression analysis, and to display the slope, intercept, and correlation Save the Experiment Using the same instrument settings and Experiment document, acquire your Bead SingletsLowMedLow MedHighHigh0100 Counts100104FL2 Page 323-3337-05cellular assay samples.
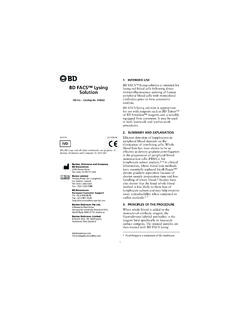
4 All subsequently collected data files will save the information displayed in the Quantitative Calibration window. You can print an active Quantitative Calibration window by selecting Print from the File menu. QuantiCALC can read the regression information for analysis of assay detailed information on using the Quantitative Calibration option, refer to Chapter 10 of the BD CellQuest software Reference Manual (version or later).Manual analysisUse the following procedure to calculate the PE molecules per cell of the population of interest, if you do not have BD CellQuest or later On a statistics spreadsheet, enter the geometric means from the Histogram Statistics view (Figure 3) for the four Enter the lot-specific values for the PE molecules per bead (provided in each BD Quantibrite PE kit box).3. Calculate the Log10 for the FL2 geometric means and for the PE molecules per bead as illustrated in the following :4. Plot a linear regression of Log10 PE molecules per bead against Log10 fluorescence, using the following equation:y = mx + cwhere y equals Log10 fluorescence and x equals Log10 PE molecules per bead (Figure 4)Figure 4 Linear regression of Log10 PE molecules per bead5.
5 To determine ABC* for an unknown cell population, substitute Log FL2 geometric means in the equation and solve for Log ABC. Determine the anti-Log to get :FL2 Geometric MeansLog FL2PE Molecules/BeadLog PE , , , , , * This calculation assumes a PE to mAb ratio of 1 PE/BeadLog FL2y = x = 4If FL2 fluorescence of the cell population is 500, and Log 10 500 = , using the equation from Figure 4, y = , we solve for x:HANDLING AND STORAGES tore foil pouches at 2 C 8 C and do not freeze. Protect from exposure to light. The reagent is stable until the expiration date shown on the pouch label when stored as the pellet immediately after removing the tube from the pouch. The reconstituted pellet is stable for 24 hours when protected from light and stored at 2 C 8 that can affect quantitation include, but are not limited to, fixation, source of antibody, and clonal variation. Refer to the BD Quantibrite white paper for more biological specimens and materials coming in contact with them are considered biohazards.
6 Handle as if capable of transmitting infection4,5 and dispose of with proper precautions in accordance with federal, state, and local regulations. Never pipette by mouth. Wear suitable protective clothing, eyewear, and otherwise indicated in any applicable BD general conditions of sale for non-UScustomers, the following warranty applies to the purchase of these PRODUCTS SOLD HEREUNDER ARE WARRANTED ONLY TO CONFORM TO THE QUANTITY AND CONTENTS STATED ON THE LABEL OR IN THE PRODUCT LABELING AT THE TIME OF DELIVERY TO THE CUSTOMER. BD DISCLAIMS HEREBY ALL OTHER WARRANTIES, EXPRESSED OR IMPLIED, INCLUDING WARRANTIES OF MERCHANTABILITY AND FITNESS FOR ANY PARTICULAR PURPOSE AND NONINFRINGEMENT. BD S SOLE LIABILITY IS LIMITED TO EITHER REPLACEMENT OF THE PRODUCTS OR REFUND OF THE PURCHASE PRICE. BD IS NOT LIABLE FOR PROPERTY DAMAGE OR ANY INCIDENTAL OR CONSEQUENTIAL DAMAGES, INCLUDING PERSONAL INJURY, OR ECONOMIC LOSS, CAUSED BY THE PRODUCT. REFERENCES1.
7 Davis K, Abrams B, Hoffman RA, Bishop JE. Quantitation and valence of antibodies bound to cells. Cytometry. 1996; #AC150 (Suppl. 8) Iyer S, Suni M, Davis K, Maino V. Expression of CD69 on activated T cells using R-phycoerythrin labeled Beads . Cytometry. 1996; #AC78 ( ) Iyer S, Bishop J, Abrams, B, et al. Quantibrite: A New Standard for Fluorescence Quantitation. Becton Dickinson Immunocytometry Systems, San Jose, CA. 1997. White of Laboratory Workers from Occupationally Acquired Infections; Approved Guideline Third Edition. Wayne, PA: Clinical and Laboratory Standards Institute; 2005. CLSI document Centers for Disease Control. Perspectives in disease prevention and health promotion update: universal precautions for prevention of transmission of human immunodeficiency virus, hepatitis B virus, and other bloodborne pathogens in health-care settings. MMWR. 1988;37 AND TRADEMARKSBD, BD Logo and all other trademarks are property of Becton, Dickinson and Company.
8 2014 = = + = = Log10 PE/cell = molecules/cell = 27,334 When PE:mAb ratio is 1:1, then: ABC = 27,334