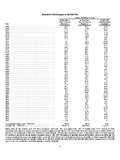
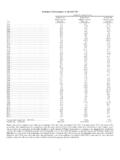
Transcription of Berkshire’s Performance vs. the S&P 500
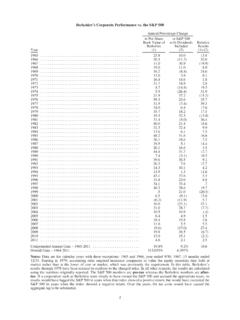
1 Berkshire's Performance vs. the S&P 500. annual Percentage Change in Per-Share in Per-Share in S&P 500. Book Value of Market Value of with Dividends Year Berkshire Berkshire Included 1965 .. 1966 .. ( ) ( ). 1967 .. 1968 .. 1969 .. ( ). 1970 .. ( ) 1971 .. 1972 .. 1973 .. ( ) ( ). 1974 .. ( ) ( ). 1975 .. 1976 .. 1977 .. ( ). 1978 .. 1979 .. 1980 .. 1981 .. ( ). 1982 .. 1983 .. 1984 .. ( ) 1985 .. 1986 .. 1987 .. 1988 .. 1989 .. 1990 .. ( ) ( ). 1991 .. 1992 .. 1993 .. 1994 .. 1995 .. 1996 .. 1997 .. 1998 .. 1999 .. ( ) 2000 .. ( ). 2001 .. ( ) ( ). 2002 .. ( ) ( ). 2003 .. 2004 .. 2005 .. 2006 .. 2007 .. 2008 .. ( ) ( ) ( ). 2009 .. 2010 .. 2011 .. ( ) 2012 .. 2013 .. 2014 .. Compounded annual Gain 1965-2014.
2 Overall Gain 1964-2014 .. 751,113% 1,826,163% 11,196%. Notes: Data are for calendar years with these exceptions: 1965 and 1966, year ended 9/30; 1967, 15 months ended 12/31. Starting in 1979, accounting rules required insurance companies to value the equity securities they hold at market rather than at the lower of cost or market, which was previously the requirement. In this table, Berkshire's results through 1978 have been restated to conform to the changed rules. In all other respects, the results are calculated using the numbers originally reported. The S&P 500 numbers are pre-tax whereas the Berkshire numbers are after-tax. If a corporation such as Berkshire were simply to have owned the S&P 500 and accrued the appropriate taxes, its results would have lagged the S&P 500.
3 In years when that index showed a positive return, but would have exceeded the S&P 500 in years when the index showed a negative return. Over the years, the tax costs would have caused the aggregate lag to be substantial. 2. A note to readers: Fifty years ago, today's management took charge at Berkshire. For this Golden Anniversary, Warren Buffett and Charlie Munger each wrote his views of what has happened at Berkshire during the past 50. years and what each expects during the next 50. Neither changed a word of his commentary after reading what the other had written. Warren's thoughts begin on page 24 and Charlie's on page 39. Shareholders, particularly new ones, may find it useful to read those letters before reading the report on 2014, which begins below.
4 BERKSHIRE HATHAWAY INC. To the Shareholders of Berkshire Hathaway Inc.: Berkshire's gain in net worth during 2014 was $ billion, which increased the per-share book value of both our Class A and Class B stock by Over the last 50 years (that is, since present management took over), per-share book value has grown from $19 to $146,186, a rate of compounded annually.*. During our tenure, we have consistently compared the yearly Performance of the S&P 500 to the change in Berkshire's per-share book value. We've done that because book value has been a crude, but useful, tracking device for the number that really counts: intrinsic business value. In our early decades, the relationship between book value and intrinsic value was much closer than it is now.
5 That was true because Berkshire's assets were then largely securities whose values were continuously restated to reflect their current market prices. In Wall Street parlance, most of the assets involved in the calculation of book value were marked to market.. Today, our emphasis has shifted in a major way to owning and operating large businesses. Many of these are worth far more than their cost-based carrying value. But that amount is never revalued upward no matter how much the value of these companies has increased. Consequently, the gap between Berkshire's intrinsic value and its book value has materially widened. With that in mind, we have added a new set of data the historical record of Berkshire's stock price to the Performance table on the facing page.
6 Market prices, let me stress, have their limitations in the short term. Monthly or yearly movements of stocks are often erratic and not indicative of changes in intrinsic value. Over time, however, stock prices and intrinsic value almost invariably converge. Charlie Munger, Berkshire Vice Chairman and my partner, and I believe that has been true at Berkshire: In our view, the increase in Berkshire's per-share intrinsic value over the past 50 years is roughly equal to the 1,826,163% gain in market price of the company's shares. * All per-share figures used in this report apply to Berkshire's A shares. Figures for the B shares are 1/1500th of those shown for A. 3. The Year at Berkshire It was a good year for Berkshire on all major fronts, except one.
7 Here are the important developments: Our Powerhouse Five a collection of Berkshire's largest non-insurance businesses had a record $ billion of pre-tax earnings in 2014, up $ billion from 2013.* The companies in this sainted group are Berkshire Hathaway Energy (formerly MidAmerican Energy), BNSF, IMC (I've called it Iscar in the past), Lubrizol and Marmon. Of the five, only Berkshire Hathaway Energy, then earning $393 million, was owned by us a decade ago. Subsequently we purchased another three of the five on an all-cash basis. In acquiring the fifth, BNSF, we paid about 70% of the cost in cash and, for the remainder, issued Berkshire shares that increased the number outstanding by In other words, the $12 billion gain in annual earnings delivered Berkshire by the five companies over the ten-year span has been accompanied by only minor dilution.
8 That satisfies our goal of not simply increasing earnings, but making sure we also increase per-share results. If the economy continues to improve in 2015, we expect earnings of our Powerhouse Five to improve as well. The gain could reach $1 billion, in part because of bolt-on acquisitions by the group that have already closed or are under contract. Our bad news from 2014 comes from our group of five as well and is unrelated to earnings. During the year, BNSF disappointed many of its customers. These shippers depend on us, and service failures can badly hurt their businesses. BNSF is, by far, Berkshire's most important non-insurance subsidiary and, to improve its Performance , we will spend $6 billion on plant and equipment in 2015.
9 That sum is nearly 50% more than any other railroad has spent in a single year and is a truly extraordinary amount, whether compared to revenues, earnings or depreciation charges. Though weather, which was particularly severe last year, will always cause railroads a variety of operating problems, our responsibility is to do whatever it takes to restore our service to industry-leading levels. That can't be done overnight: The extensive work required to increase system capacity sometimes disrupts operations while it is underway. Recently, however, our outsized expenditures are beginning to show results. During the last three months, BNSF's Performance metrics have materially improved from last year's figures.
10 Our many dozens of smaller non-insurance businesses earned $ billion last year, up from $ billion in 2013. Here, as with our Powerhouse Five, we expect further gains in 2015. Within this group, we have two companies that last year earned between $400 million and $600 million, six that earned between $250. million and $400 million, and seven that earned between $100 million and $250 million. This collection of businesses will increase in both number and earnings. Our ambitions have no finish line. Berkshire's huge and growing insurance operation again operated at an underwriting profit in 2014 that makes 12 years in a row and increased its float. During that 12-year stretch, our float money that doesn't belong to us but that we can invest for Berkshire's benefit has grown from $41 billion to $84.