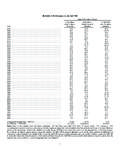
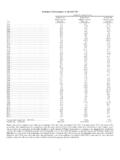
Transcription of Berkshire’s Performance vs. the S&P 500
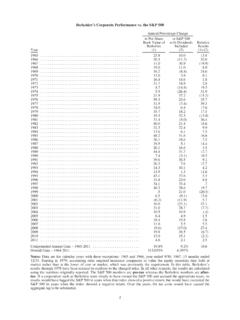
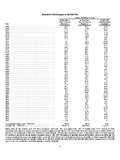
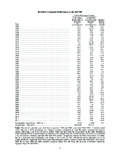
1 berkshire 's Performance vs. the S&P 500. Annual Percentage Change in Per-Share in Per-Share in S&P 500. Book Value of Market Value of with Dividends Year berkshire berkshire Included 1965 .. 1966 .. ( ) ( ). 1967 .. 1968 .. 1969 .. ( ). 1970 .. ( ) 1971 .. 1972 .. 1973 .. ( ) ( ). 1974 .. ( ) ( ). 1975 .. 1976 .. 1977 .. ( ). 1978 .. 1979 .. 1980 .. 1981 .. ( ). 1982 .. 1983 .. 1984 .. ( ) 1985 .. 1986 .. 1987 .. 1988 .. 1989 .. 1990 .. ( ) ( ). 1991 .. 1992 .. 1993 .. 1994 .. 1995 .. 1996 .. 1997 .. 1998 .. 1999 .. ( ) 2000 .. ( ). 2001 .. ( ) ( ). 2002 .. ( ) ( ). 2003 .. 2004 .. 2005 .. 2006 .. 2007 .. 2008 .. ( ) ( ) ( ). 2009 .. 2010 .. 2011 .. ( ) 2012 .. 2013 .. 2014 .. 2015 .. ( ) 2016 .. 2017 .. Compounded Annual Gain 1965-2017.
2 Overall Gain 1964-2017 .. 1,088,029% 2,404,748% 15,508%. Note: Data are for calendar years with these exceptions: 1965 and 1966, year ended 9/30; 1967, 15 months ended 12/31. Starting in 1979, accounting rules required insurance companies to value the equity securities they hold at market rather than at the lower of cost or market, which was previously the requirement. In this table, berkshire 's results through 1978 have been restated to conform to the changed rules. In all other respects, the results are calculated using the numbers originally reported. The S&P 500 numbers are pre-tax whereas the berkshire numbers are after-tax. If a corporation such as berkshire were simply to have owned the S&P 500 and accrued the appropriate taxes, its results would have lagged the S&P 500 in years when that index showed a positive return, but would have exceeded the S&P 500 in years when the index showed a negative return.
3 Over the years, the tax costs would have caused the aggregate lag to be substantial. 2. berkshire HATHAWAY INC. To the Shareholders of berkshire Hathaway Inc.: berkshire 's gain in net worth during 2017 was $ billion, which increased the per-share book value of both our Class A and Class B stock by 23%. Over the last 53 years (that is, since present management took over), per- share book value has grown from $19 to $211,750, a rate of compounded annually.*. The format of that opening paragraph has been standard for 30 years. But 2017 was far from standard: A. large portion of our gain did not come from anything we accomplished at berkshire . The $65 billion gain is nonetheless real rest assured of that. But only $36 billion came from berkshire 's operations.
4 The remaining $29 billion was delivered to us in December when Congress rewrote the Tax Code. (Details of berkshire 's tax-related gain appear on page K-32 and pages K-89 K-90.). After stating those fiscal facts, I would prefer to turn immediately to discussing berkshire 's operations. But, in still another interruption, I must first tell you about a new accounting rule a generally accepted accounting principle (GAAP) that in future quarterly and annual reports will severely distort berkshire 's net income figures and very often mislead commentators and investors. The new rule says that the net change in unrealized investment gains and losses in stocks we hold must be included in all net income figures we report to you. That requirement will produce some truly wild and capricious swings in our GAAP bottom-line.
5 berkshire owns $170 billion of marketable stocks (not including our shares of Kraft Heinz), and the value of these holdings can easily swing by $10 billion or more within a quarterly reporting period. Including gyrations of that magnitude in reported net income will swamp the truly important numbers that describe our operating Performance . For analytical purposes, berkshire 's bottom-line will be useless. The new rule compounds the communication problems we have long had in dealing with the realized gains (or losses) that accounting rules compel us to include in our net income. In past quarterly and annual press releases, we have regularly warned you not to pay attention to these realized gains, because they just like our unrealized gains fluctuate randomly.
6 That's largely because we sell securities when that seems the intelligent thing to do, not because we are trying to influence earnings in any way. As a result, we sometimes have reported substantial realized gains for a period when our portfolio, overall, performed poorly (or the converse). *All per-share figures used in this report apply to berkshire 's A shares. Figures for the B shares are 1/1500th of those shown for the A shares. 3. With the new rule about unrealized gains exacerbating the distortion caused by the existing rules applying to realized gains, we will take pains every quarter to explain the adjustments you need in order to make sense of our numbers. But televised commentary on earnings releases is often instantaneous with their receipt, and newspaper headlines almost always focus on the year-over-year change in GAAP net income.
7 Consequently, media reports sometimes highlight figures that unnecessarily frighten or encourage many readers or viewers. We will attempt to alleviate this problem by continuing our practice of publishing financial reports late on Friday, well after the markets close, or early on Saturday morning. That will allow you maximum time for analysis and give investment professionals the opportunity to deliver informed commentary before markets open on Monday. Nevertheless, I expect considerable confusion among shareholders for whom accounting is a foreign language. At berkshire what counts most are increases in our normalized per-share earning power. That metric is what Charlie Munger, my long-time partner, and I focus on and we hope that you do, too.
8 Our scorecard for 2017 follows. Acquisitions There are four building blocks that add value to berkshire : (1) sizable stand-alone acquisitions; (2) bolt-on acquisitions that fit with businesses we already own; (3) internal sales growth and margin improvement at our many and varied businesses; and (4) investment earnings from our huge portfolio of stocks and bonds. In this section, we will review 2017 acquisition activity. In our search for new stand-alone businesses, the key qualities we seek are durable competitive strengths;. able and high-grade management; good returns on the net tangible assets required to operate the business;. opportunities for internal growth at attractive returns; and, finally, a sensible purchase price.
9 That last requirement proved a barrier to virtually all deals we reviewed in 2017, as prices for decent, but far from spectacular, businesses hit an all-time high. Indeed, price seemed almost irrelevant to an army of optimistic purchasers. Why the purchasing frenzy? In part, it's because the CEO job self-selects for can-do types. If Wall Street analysts or board members urge that brand of CEO to consider possible acquisitions, it's a bit like telling your ripening teenager to be sure to have a normal sex life. Once a CEO hungers for a deal, he or she will never lack for forecasts that justify the purchase. Subordinates will be cheering, envisioning enlarged domains and the compensation levels that typically increase with corporate size.
10 Investment bankers, smelling huge fees, will be applauding as well. (Don't ask the barber whether you need a haircut.) If the historical Performance of the target falls short of validating its acquisition, large synergies will be forecast. Spreadsheets never disappoint. The ample availability of extraordinarily cheap debt in 2017 further fueled purchase activity. After all, even a high-priced deal will usually boost per-share earnings if it is debt-financed. At berkshire , in contrast, we evaluate acquisitions on an all-equity basis, knowing that our taste for overall debt is very low and that to assign a large portion of our debt to any individual business would generally be fallacious (leaving aside certain exceptions, such as debt dedicated to Clayton's lending portfolio or to the fixed-asset commitments at our regulated utilities).