Transcription of BEYOND GLYCEMIC INDEX: NEW FOOD INSULIN …
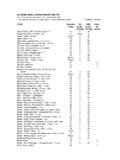
1 BEYOND GLYCEMIC INDEX: NEW FOOD INSULIN index Laura Sampson Kent*Mary Franz*Jennie Brand Miller**Walter Willett**Department of Nutrition, Harvard School of Public Health**University of SydneyAcknowledgement: This research was funded by grant CA55075, National Cancer Institute, National Institutes of OF INSULIN SECRETION Prevention and management of weight gain Hyperlipidemia Non INSULIN dependent diabetes mellitus (NIDDM) Long term exposure to high INSULIN concentrations may be associated with increased risk of cancer yWHATISFOODINSULININDEX(FII)?WHAT IS FOOD INSULIN index (FII)?Directlyquantifiesthepostprandiali nsulinDirectly quantifies the postprandial INSULIN response to an isoenergetic portion of a testfoodincomparisontoareferencetest food in comparison to a reference food AllowstestingoffoodswithnoorlowAllows testing of foods with no or low carbohydrate contenthbhdhlFII has been shown to predict the relative INSULIN demand evoked by mixed meals FOODINSULININDEX(FII)FOOD INSULIN index (FII) MeasuresbloodinsulinresponsetoafoodMeasu res blood INSULIN response to a food compared to a reference food glucose (FII=100) Measures incremental INSULIN area under the curve(AUC)overtwohoursinresponsetocurve (AUC)
2 Over two hours in response to consumption of a 1000 kJ portion of the test fooddividedbytheAUCafteringestionofafood divided by the AUC after ingestion of a 1000 kJ portion of the reference foodHowisFIID ifferentfromGlycemicIndex?How is FII Different from GLYCEMIC index ?FOODINSULININDEXGLYCEMICINDEXFOOD INSULIN index Measures postprandial increase in insulinsecretion GLYCEMIC index Measures effect of carbohydrate containing of a wholefood dfoods on postprandial increase in blood glucose levels Dependent on carbohydrate, quantity and quality of protein and fat levels GI is not always proportional to the INSULIN qypand their interactionsresponseMETHODSMETHODS APPROXIMATELY100 FOODSAND16 CEREALSAPPROXIMATELY 100 FOODS AND 16 CEREALS WERE ANALYZED USING GLUCOSE AS THE REFERENCE FOOD 407 FOODS, 147 MARGARINES, 58 OILS.
3 111 CEREALS WERE IMPUTED USING VARIOUS ALGORITHMS 166 FOODS AND 89 CEREALS WERE RECIPE DERIVED 44 FOODS WERE ASSUMED TO BE 0 FOODSSENTTOUNIVERSITYOFSYDNEYFOODS SENT TO UNIVERSITY OF SYDNEYMUFFIN MIXES SunMaid honey raisin bran muffin mixDHibl bREADYMADE Duncan Hines blueberry muffin mix Kr steafatfreeREADY MADE SWEET ROLL Krusteaz fat free blueberry muffin mix Entenmanncinnamon Entenmann cinnamon bunsCakeMix Betty Crocker golden cake w/ Cake MixBetty Crocker choc frosting Aunt Jemima pancake mixPancake Mix Chips Ahoy regular chocolate chip ChipsAhoyreducedfatchocolateCookiesChips Ahoy reduced fat chocolate chip Archway fat free oatmeal raisin Cape Cod reduced fat potato chipsChipschips Snickers candy bars Hershey candy barspCandy Analyzed CerealsCEREALS CheeriosCEREALS Shredded Wheat Corn Flakes Quaker 100% Natural Cracklin Oat BranLkCh Lucky Charms Frosted Flakes GreatGrainsGreat Grains Honey Bunches of Oats WheatiesMatching Foods Purchased in SydneyDairy Cream cheese Low fat cheddar cheeseMeat, fish.
4 Mixed dishes Tacos Lasagna Low fat processed cheese Low fat cottage cheese Low fat ice cream Sherbet Roast chicken Shrimp Tofu TunainoilSherbet 1% milk ButterFitfitdi kTuna in oil BaconMiscellaneous itemsFruits or fruit drinks Peaches canned in juice Peaches canned in syrup Orange juice Olive oil Navy beans Raspberry jam Pretzelsgj Prunes PunchCerealsKhiiff Walnuts Corn tortillas Jatz crackers (similar to Ritz) Kashi 7 grain puffs Rice BubblesRecipe derivedFIIV aluesRecipederived FII Values Used analyzed foods as ingredients Used ingredients that were imputed from analyzed : apple butter FII = 52dfldDerived from recipe using apple, , and sugar as ingredients (all analyzed foods)
5 IMPUTEDORCALCULATEDFIIVALUESIMPUTED OR CALCULATED FII VALUESFOODSCALCULATIONC ereal grains, baked goods, sweets and snack foods, beveragesfruitsanddairySimilar analyzed foods and a carb/1000 kj adjustmentbeverages, fruits, and dairycarb/1000 kj imputed foodx FIIcarb/1000 kj analyzed foodBreakfast cerealsUsed analyzed cereals adjusting for carbohydrate/amountMeats, fish, and poultryDirectly from similar analyzed foodsIMPUTEDFIIVEGETABLEVALUESIMPUTED FII VEGETABLE VALUESVEGETABLESCALCULATIONSVEGETABLES NON STARCHYCALCULATIONSR ecipe from avocado using an h2o ratio STARCHY2 Recipe from potatoes or carrotsusingfiberratioscarrots using fiber ratiosRecipe from beans using an PEAS and LIMA BEANS fiber ratioFIIPUBLICATIONSFII PUBLICATIONSBao J, de JongV, Atkinson F, Petocz P, Brand Miller ,g,,,JC.
6 Food INSULIN index : physiologic basis for predicting INSULIN demand evoked by composite mealsAmJClinNutr2009;90:986992meals. Am J ClinNutr2009;90:986 :Holt SH, Miller JC, & PetoczP. An INSULIN index of foods: the INSULIN demand generated by 1000 kJ portions of common foods. Am J Clin Nutr, 66:1264 67; of the mixed meal study: M1 Group 1M7M8 Group 2BA400500L)M2M3M4M5400500M8M9M10M11M1220 0300nsulin (pmol/M5M6 White Bread200300M12M13 White Br e ad0100200I010000 1530 456090120 Tim e (m in)00 1530456090120 Tim e (m in)Bao J et al. Am J Clin Nutr 2009;90 : CorrelationsAr = , P = )80100in responsbread =10406080rved insultive white 02040 Obse (Rela00 20406080100120 INSULIN demand predicted by Food INSULIN IndexRESULTS.
7 CorrelationsBr = , P = )100120n responseread =100)6080ed insulinve white br2040 Observe (Relativ00 20406080100 Available carbohydrate content (g)a ab e ca bo yd ate co te t (g)HighestversusLowestFIIV aluesHighest versus Lowest FII Values HighestanalyzedFII LowestanalyzedFIIH ighest analyzed FIIJ elly Beans (120)Pancakes(112)Lowest analyzed FIIO live Oil (3)Avocado(5)Pancakes (112)Honeydew Melon (95)Potatoes(90)Avocado (5)Walnuts (6)Tuna(16)Potatoes (90)Breakfast Cereals (70 113)Tuna (16)Chicken (20)MEAN ANALYZED VS MEAN IMPUTED FII DATA100506070809010203040500 LEGUMESPROTEINDAIRYFRUITYFOODSSWEETSCERE ALSNUTS & LEPRSTARCHY SBREAKFAST CANALYZEDIMPUTEDLIMITATIONSLIMITATIONS AlthoughimputedFIIdataaresimilartoAlthou gh imputed FII data are similar to analyzed data, algorithms used for imputing FII have not been validated.
8 FIIvariabilitywithinsomefoodgroupsFII variability within some food groups complicates the assignment of imputed values. For example, analyzed FII for dairy foods range from 18 for cream cheese to 86 for fruited Most vegetables produce negligible INSULIN response, gpggp,as measured by FII. Even fats, and protein sources produce largely variable INSULIN responses, as measured by FII. Imputed FII values track closely to analyzed values. Refined cereals, sweets, and potatoes produce the greatest INSULIN response, as measured by INSULIN LOADI nsulin Load, Glucose = (calories*FII)/100 thidiid lili ild the individual average insulinogenic load (IL) during the past year was estimated fFFQblti l ithFIIfhfrom FFQs by multiplying the FII of each food by its energy content and the tifdiconsumption frequency and summing over all reported food items.
9 DIETARYINSULININDEXDIIDIETARY INSULININDEX, DIIThe average dietary DII was calculated by dividing the IliLdILbthaverage INSULIN Load, IL, by the totaldailyenergyintaketotal daily energy FROM COHORT STUDIESMEN MedianILwas840 WOMEN MedianILwas677 Median IL was 840 Median DII was Median IL was 677 Median DII was TOP8 FOODSCONTRIBUTINGTOILTOP 8 FOODS CONTRIBUTING TO ILMENWOMENMENCold Cereal ( )Potatoes(5 7%)WOMENM ashed Potatoes ( )SkimmedMilk(5 7%)Potatoes ( ) Dark Bread ( )SkimmedMilk(3 2%)Skimmed Milk ( )Cold Cereal ( )DkBd(4 6%)Skimmed Milk ( ) Bananas ( ) EnglishMuffin(3 1%)Dark Bread ( )Beef ( )Y(3 3%)English Muffin ( ) White Bread ( ) OrangeJuice( )Yogurt ( )White Bread ( ) Orange Juice ( ) English Muffin ( ) TOP 4 FFQ ITEMS explaining the inter ddlflldindividual variation of INSULIN loadMENWOMENMEN49%WOMEN45%LIQUOR LIQUORCOLD CEREAL BEERWINEYOGURTBEERWINEYOGURT COLD CEREALCOHORTSTUDYRESULTSCOHORT STUDY RESULTSIn multivariate adjusted regression models, dietary II and IL were not iifi tlitdithlCtidsignificantly associated with plasma C in the highest quintile of both II and IL had 26% higher triacylglycerolconcentrationsthanpartici pantsinthelowesttriacylglycerol concentrations than participants in the lowest quintile (ptrend< ).
10 ThepositiveassociationbetweenIIandILandp lasmatriacylglycerolThe positive association between II and IL and plasma triacylglycerol was strongest in obese (BMI 30 kg/m2) participants (difference highest versus lowest quintile in II = 72%, ptrend= ). An inverse association between DII and HDL cholesterol was observed among obese participants (difference = 22%, ptrend= for II). DII and IL were not associated with LDL cholesterol, CRP or IL 6. CONCLUSIONCONCLUSIONDII and IL were not associated with markers of GLYCEMIC control at least in the fastingof GLYCEMIC control, at least in the fasting state, but may be physiologically relevant to plasma lipids especially in the obeseplasma lipids, especially in the obese.