Transcription of Biology 112 Introduction to Ecology Session: Section ...
1 Biology 112 Introduction to Ecology Final Exam FNX Session: Section : Class Location: Days / Time: Instructor: FALL 2015 54018 3 Units NVC 2240 M 6:00 PM 8:50 PM RIDDELL Page 1 of 23 BIO 112 F 2105 54018 FNX Q Student Learning Outcome 1 Apply quantitative models that describe population growth and dynamics. Population Statement / Question CODE Answer Choices Population and education by gender: 1. Over the past 40 years more adult women have completed college than adult men. T / F 2. Late 20 yo women began to surpass late 20 yo men in college graduation rates about year ___.
2 3. Equal numbers of men and women graduate / completed college in year_____. 4. A higher percentage of men are expected to complete college in 2020. T / F. A B C D E AB AC AD AE BC BD BE CD CE False True 1970 1975 1980 1985 1990 1995 2000 2005 2010 2015 2020 2025 Biology 112 Introduction to Ecology Final Exam FNX Session: Section : Class Location: Days / Time: Instructor: FALL 2015 54018 3 Units NVC 2240 M 6:00 PM 8:50 PM RIDDELL Page 2 of 23 BIO 112 F 2105 54018 FNX Q 5. In what way would improving the status of women in developing countries have a positive impact on achieving sustainable development?
3 A) Women are disproportionately disadvantaged b) Women are charged with child care c) Women are the only ones that think or work d) Improvement in women s status contributes to the stability and prosperity of the community e) nothing Based on the Population Data Sheet PDF File on Last Page. Choose the value closest to your calculation for the following indicated statements. 6. The population of US is about ____ times the population of Nigeria in 2050 7. The population of China is about ____ times the population of India in 2020 8. The population of the Less Developed Countries is about ____ times the population of the More Developed Countries.
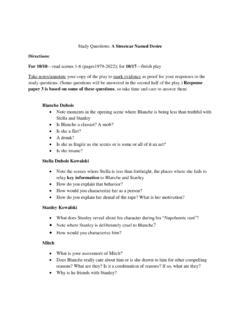
4 9. The proportion of the population under 15 years of age in the developed countries is about _____ the population under 15 years of age in the lesser developed countries as a group. C. 10. The population of China, India and Africa combined is about ____ times the population of the Americas. RATIO times As BIG As CODE RATIO times Smaller than 1 2 3 4 5 6 7 8 9 10 15 20 25 30 A B C D E AB AC AD AE BC BD BE CD CE DE ABC ABD ABE BCD 1 2 3 4 5 10 20 25 40 50 100 200 300 400 500 Biology 112 Introduction to Ecology Final Exam FNX Session: Section : Class Location: Days / Time: Instructor: FALL 2015 54018 3 Units NVC 2240 M 6:00 PM 8:50 PM RIDDELL Page 3 of 23 BIO 112 F 2105 54018 FNX Q Population Growth Profiles Match the Term with the Population dynamics below shown below.
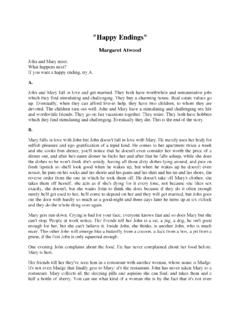
5 Answer Choices A. Declining B. Rapid C. Stable D. Logistic E. Undeterminable 11. __ 12. __ 13. __ 14. __ Match the annotated illustration to the definitions listed below the figure. Definitions for Classification of growth dynamics. 15. Exponential 16. Linear 17. Logistic Biology 112 Introduction to Ecology Final Exam FNX Session: Section : Class Location: Days / Time: Instructor: FALL 2015 54018 3 Units NVC 2240 M 6:00 PM 8:50 PM RIDDELL Page 4 of 23 BIO 112 F 2105 54018 FNX Q 18.
6 In the associated figure, Algae has the lowest concentration of DDT because it is: ___ 19. In the associated figure, the gull has the highest concentration of DDT because it is ___: Data CODE Relationship A B C D E a more complex organism. an older organism. at the bottom of the food chain. at the top of the food chain. homoeothermic (warm-blooded). Biology 112 Introduction to Ecology Final Exam FNX Session: Section : Class Location: Days / Time: Instructor: FALL 2015 54018 3 Units NVC 2240 M 6:00 PM 8:50 PM RIDDELL Page 5 of 23 BIO 112 F 2105 54018 FNX Q Student Learning Outcome 2 Describe and compare competitive interactions between two species.
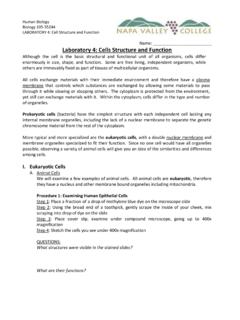
7 Species Interaction and Interdependence CODE TERM / Relationship A B C D E AB Commensalism Competitive Exclusion Competitive limited resources Mutualism Predation Resource partitioning Species A Species B Positive for A Neutral for A Negative for A And Positive for B 20. ____ 21. ____ And Neutral for B And Negative for B 22. ____ 23. ____ Biology 112 Introduction to Ecology Final Exam FNX Session: Section : Class Location: Days / Time: Instructor: FALL 2015 54018 3 Units NVC 2240 M 6:00 PM 8:50 PM RIDDELL Page 6 of 23 BIO 112 F 2105 54018 FNX Q Select Food Web Match the annotated illustration to the definitions listed below the figure.
8 Trophic Level Energy Per Level 24. Primary Consumer 25. Primary Producer 26. Secondary Consumer 27. Tertiary Consumer 28. 10,000 29. 10 30. 1,000 31. 100 Biology 112 Introduction to Ecology Final Exam FNX Session: Section : Class Location: Days / Time: Instructor: FALL 2015 54018 3 Units NVC 2240 M 6:00 PM 8:50 PM RIDDELL Page 7 of 23 BIO 112 F 2105 54018 FNX Q 4. Ecosystems and Living Organisms 32. The common way that a species is defined is that a members of a species includes all organisms that are similar enough to a) fill the same niche b) occupy the same community c) live together d) freely interbreed in the wild e) be classified in the same kingdom 33.
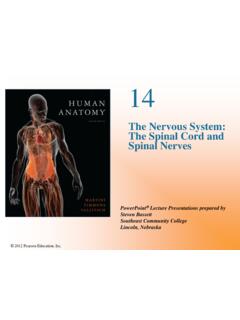
9 Based on the figure below, what can be deduced from the data regarding number of consumer species as the structural complexity of the vegetation increases: 34. Based on the figure below, what can be deduced from the data regarding the structural complexity of the vegetation as latitude decreases: Data Data CODE Relationship / Dynamic A B C D E Changes randomly Decreases Fluctuates Increases Remains stable Number of consumer speciesStructural complexity of vegetationStructural Complexity of VegetationLattitudeBiology 112 Introduction to Ecology Final Exam FNX Session: Section : Class Location: Days / Time: Instructor: FALL 2015 54018 3 Units NVC 2240 M 6:00 PM 8.
10 50 PM RIDDELL Page 8 of 23 BIO 112 F 2105 54018 FNX Q 35. The reason(s) that tropical regions of the world have such high biodiversity is: a) because they are geologically stable. b) because they have a high productivity. c) because there are many ecological niches. d) All of the above e) None of the above Chapter 1: Environmental Science and Sustainability 36. The ability to meet humanity s current needs without compromising the ability of future generations to meet their needs is termed: a) Ecology . b) environmental sustainability. c) natural balance.