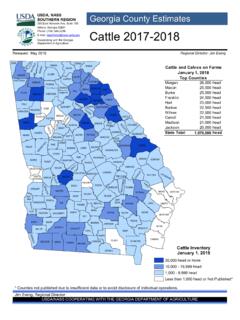
Transcription of Black Producers - National Agricultural Statistics Service
1 Black Producers Highlights Up 5 percent since 2012; one-fifth serve or have served in the military ACH17-9/October 2019. In 2017, the United States had 48,697 Producers who identified as Black , 48,697. either alone or in combination with another race. They accounted for Producers percent of the country's million Producers , and they lived and farmed million primarily in southeastern and mid-Atlantic states. Black Producers were acres older and more likely to have served or to be serving in the military than Producers overall. Their farms were smaller and the value of their $ billion agriculture sales was less than 1 percent of the total.
2 agriculture sales Top States Number and Location Number of Producers and Farms, Black and All Black Producers , 2017. 2012 2017 % change The 2017 Census of agriculture revised Texas 11,741. the demographic data collected to Producers Mississippi 7,028. better capture the contributions of Black 46,582 48,697 +5. Alabama 4,208. all persons involved in Agricultural All 3,180,074 3,399,834 +7. Louisiana 3,222. production. In response to detailed Georgia 2,870. questions about farm decision Farms S. Carolina 2,634. making, more farms reported multiple Black -operated 36,382 35,470 -3.
3 Florida 2,448. individuals involved in farm operations. All 2,109,303 2,042,220 -3. N. Carolina 2,099. Oklahoma 2,074. As a result of the new approach to Virginia 1,767. counting Producers , the total number 88. Arkansas 1,525. of Producers increased 7 percent The percent of Black Producers Tennessee 1,422. between 2012 and 2017. The increase who live in the top twelve states. in Black Producers was 5 percent. The number of Black -operated farms, like the total number of farms, declined Black -operated Farms as Percent of Total Farms, by County, 2017. 3 percent between 2012 and 2017, when Black Producers operated 35,470.
4 Farms. Three counties had more than 300. In Texas, with more Black Producers Black -operated than any other state, Black Producers farms: Smith were 3 percent of the state's total County, Texas, (335 farms), Producers . Black Producers made up <1 Freestone County, a larger share of total Producers in 1-4 Texas (319 farms), Mississippi (13 percent), Louisiana 5 - 14 and Marion County, (7 percent), South Carolina (7 percent), 15 - 24 Florida (309 farms). = Alabama (6 percent), and Georgia (4 25 +. percent). Note: Based on 32,910 farms with Producers who identified themselves as Black alone.
5 United States Department of agriculture National Agricultural Statistics Service SNAPSHOT. Producer Characteristics Black Producers , 2017. Black Producers are on average older than Producers overall ( 19. Number = 48,697*. Black All versus years in 2017) and more likely to have served or be serving in the military. A larger share are male (percent). (71 percent versus 64 percent for all Producers ). A smaller share lived on their farm (61 percent The percent of Black Producers Sex with military Service , compared with Male 71 64 compared with 74 percent for all). 11 percent of all Producers .
6 Female 29 36. Age Farm Characteristics <35 6 8. 35 - 64 51 58 Black -operated farms sold $ billion in Agricultural products in 2017, with 61 percent 65+ 43 34 ($858 million) in crop sales and 39 percent ($559 million) in sales of livestock and livestock products. These farms accounted for percent of total agriculture sales. They received Years farming $59 million in government payments in 2017. 10 or less 29 27. 11 or more 71 73 Black -operated and Farms by Economic Class, 2017 (percent). (sales and government payments combined). Lived on their farm 61 74 Fifty-seven percent < $1,000 30 of Black -operated 23 farms had sales Worked off farm 27 and government No days 40 39 $1,000 to $4,999.
7 21 payments of less 1 to 199 days 25 21 than $5,000 per 200+ days 35 40 $5,000 to $9,999 15. 11 Black -operated year; 7 percent had All sales and payments primary occupation $10,000 to $49,999 21 of $50,000 or more, 20. Farming 44 42 compared with Other 56 58 $50,000 + 7 25 percent of 25 all farms. Hispanic 3 3. With military Service 19 11 Farms and Land Farm Specializationa Black -operated farms accounted Nearly half (48 percent) of Black -operated Average age (years) for million acres of farmland, percent farms specialized in cattle and dairy *Of the total, 45,508 identified themselves as Black alone, of the total.
8 The majority of these farms production in 2017, almost all in beef cattle and 3,189 as Black in combination with another race. (85 percent), like farms generally production. Data collected for up to four Producers per farm. (70 percent), had fewer than 180 acres. % of The average size of Black -operated farms farms was 132 acres. Oilseeds and grains 7. Specialty crops 12. About the Census Farm Size Black - All (fruits, vegetables, nursery). in Acres operated The Census of agriculture , conducted Other crops 18. once every five years, is a complete (percent of total). Cattle and dairy 48.
9 Count of farms and ranches and 1 to 9 16 13 Hogs and pigs 1. the people who operate them. Results 10 to 49 36 29 Poultry and eggs 1. from the 2017 and earlier censuses 50 to 179 33 28. are available at National , state, and Sheep and goats 4. 180 to 499 11 15 Other animals 9. county levels. 500 + 4 15. See the searchable database Quick 16,934. Stats, the new Census Data Query Tool, Two thirds (67 percent) of Black -operated downloadable PDF reports, maps, and farms were operated by farmers who own a variety of topic-specific products all the land they farm, 9 percent by farmers including profiles by race, ethnicity, who rent all the land.
10 The number of Black -operated and sex. farms specializing in beef cattle. 62. a Refers to the North American Industry Classification System The percent of Black -operated (NAICS). More than half of a farm's sales come from the farms with internet access. commodity. Source: USDA NASS, 2017 Census of agriculture . USDA is an equal opportunity provider, employer, and lender.