Transcription of BlackRock Equity Index Non-Lendable Fund (Class M)
1 BlackRock Equity Index Non-Lendable fund (Class M)AS OF 2022-03-31 INVESTMENT STRATEGY: The fund is an " Index fund " that seeks investment results that correspond generally to the price andyield performance, before fees and expenses, of a particular Index . The fund shall be invested and reinvested in a portfolio of equitysecurities with the objective of approximating as closely as practicable the capitalization weighted total rate of return of that segment ofthe United States market for publicly traded Equity securities represented by the larger capitalized companies. The criterion for selectionof investments shall be the S&P 500 Index . BTC uses a "passive" or indexing approach to try to achieve the fund 's investmentobjective.
2 Unlike many funds, the fund does not try to outperform the Index it seeks to track and does not seek temporary defensivepositions when markets decline or appear Category:StockMorningstar Categoryc21:Large BlendPORTFOLIO DETAILSI nception Date2009-02-23 Gross Expense Ratiof1 (%) Expense Ratiof1 (%) Total Net Assets ($M)3, CompanyBlackRock Institutional TrustCompany NAPortfolio ManagersManagement TeamTOP TEN HOLDINGS AS OF 2022-03-31% of AssetsApple Inc Class Inc Class Hathaway Inc Class Platforms Inc Class Group STATISTICST urnover Ratio (%) (annualized)5 Betab1 (3y) (S&P 500 TR USD) (%) (3y) (S&P 500 TR USD) Ratiob54 (3y) # of Stock Holdings505# of Bond Holdings0 PRINCIPAL RISKSP rincipal Risks include: Collective Funds, Derivatives, EquitySecurities and Index Correlation/Tracking Error.
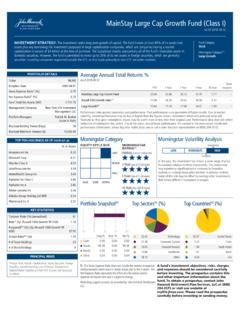
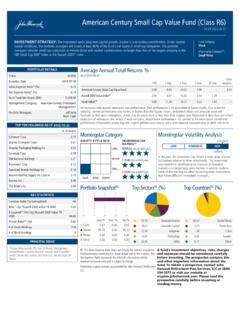
3 See disclosure Annual Total Returns %As of 2022-03-31 YTD1 Year3 Year5 Year10 YearSinceInceptionBlackRock Equity Index Non-Lendable 500 data quoted represents past performance. Past performance is no guarantee of future results. Due to marketvolatility, current performance may be less or higher than the figures shown. Investment return and principal value willfluctuate so that upon redemption, shares may be worth more or less than their original cost. Performance data does not reflectdeduction of redemption fee, which, if such fee exists, would lower performance. For current to the most recent month-endperformance information, please log onto or call a John Hancock representative at (800) CategoryEQUITY STYLE BOXLARGEMEDIUMSMALLVALUEBLENDGROWTHMORNI NGSTARRATINGm1 OVERALL (Out of 1232 Funds)3 YEAR (Out of 1232 Funds)5 YEAR (Out of 1116 Funds)10 YEAR (Out of 818 Funds)Morningstar Volatility AnalysisInvestmentLOWMODERATEHIGHC ategoryThis investment has shown a relatively moderate range ofprice fluctuations in the past.
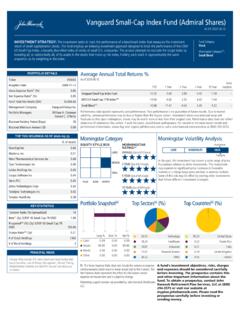
4 For this reason, it currently landsin the middle third of all investments with records of at leastthree years. However, this investment may experience largeror smaller price declines or price increases depending onmarket conditions. To offset some of the investment's risk,investors may wish to own investments with differentportfolio makeups or investment Snapshotb2-3503570105 Long %Short %Net % Sectorsb2 (%) Countriesb2 (%) . The Gross Expense Ratio does not include fee waivers or expensereimbursements which result in lower actual cost to the investor. TheNet Expense Ratio represents the effect of a fee waiver and/orexpense reimbursement and is subject to support services are provided by John Hancock and DisclosuresImportant NotesOther:m1.
5 For each fund with at least a three-year history, Morningstar calculates a MorningstarRatingTM based on a Morningstar Risk-Adjusted Return measure that accounts for variation ina fund 's monthly performance(not including the effects of sales charges, loads, andredemption fees), placing more emphasis on downward variations and rewarding consistentperformance. Exchange traded funds and open-ended mutual funds are considered a singlepopulation for comparative purposes. The top 10% of funds in each category receive fivestars, then next receive four stars, the middle 35% receive three stars, the next two stars, and the bottom 10% receive one star.
6 The Overall Morningstar RatingTMfor a fund is derived from a weighted average of the performance figures associated with itsthree-, five- and 10-year (if applicable) Morningstar RatingTM metrics. The rating formulamost heavily weights the three year rating, using the following calculation: 100% three-yearrating for 36-59 months of total returns, 60% five-year rating/40% three-year rating for60-119 months of total returns, and 50% 10-year rating/30% five-year rating/20% three-yearrating for 120 or more months of total returns. Past performance does not guarantee Beta measures the sensitivity of the fund to its benchmark. The beta of the market (asrepresented by the benchmark) is Accordingly, a fund with a beta is expected to have10% more volatility than the The portfolio composition, industry sectors, top ten holdings, and credit analysis arepresented to illustrate examples of securities that the fund has bought and diversity of areas inwhich the fund may invest and may not be representative of the fund 's current or futureinvestments.
7 The top ten holdings do not include money market instruments and/or futurescontracts. The figures presented are as of date shown, do not include the fund 's entireinvestment portfolio, and may change at any Large Blend Average is the average annual total return of the universe of mutual fundsdesignated by Morningstar, Inc. as comprising the Morningstar Large Blend R-squared measures the degree to which the fund and its benchmark Index are closer it is to 100%, the more similar the historical performance between the Sharpe ratio is a measure of excess return per unit of risk, as defined by standard higher Sharpe ratio suggests better risk-adjusted data, Style Box and Morningstar Portfolio Ratings All Morningstar data is 2017 byMorningstar, Inc.
8 All rights reserved. The information contained herein: (1) is proprietary toMorningstar and/or its content providers; (2) may not be copied or distributed; and (3) is notwarranted to be accurate, complete or timely. Neither Morningstar nor its content providers areresponsible for any damages or losses arising from any use of this Description:i47. S&P 500 Index is a market capitalization-weighted Index , composed of 500 widely-heldcommon stocks. This Index is designed to be a leading indicator of equities and is meant toreflect the risk/return characteristics of the large-cap universe. An investment cannot be madedirectly into an Category Description:c21.
9 Large-blend portfolios are fairly representative of the overall US stock market in size,growthrates and price. Stocks in the top 70% of the capitalization of the US Equity market aredefinedas large cap. The blend style is assigned to portfolios where neither growth norvaluecharacteristics predominate. These portfolios tend to invest across the spectrum ofUSindustries, and owing to their broad exposure, the portfolios' returns are often similar to thoseof the S&P 500 RisksCollective Funds: The fund is a collective investment fund and is privately offered. Thereforeinformation on this investment is not available in local : Investments in derivatives may be subject to the risk that the advisor does notcorrectly predict the movement of the underlying security, interest rate, market Index , or otherfinancial asset, or that the value of the derivative does not correlate perfectly with either theoverall market or the underlying asset from which the derivative's value is derived.
10 Becausederivatives usually involve a small investment relative to the magnitude of liquidity and other risksassumed, the resulting gain or loss from the transaction will be disproportionately investments may result in a loss if the counterparty to the transaction does not perform Securities: The value of Equity securities, which include common, preferred, andconvertible preferred stocks, will fluctuate based on changes in their issuers' financial conditions,as well as overall market and economic conditions, and can decline in the event of deterioratingissuer, market, or economic Correlation/Tracking Error: A portfolio that tracks an Index is subject to the risk thatcertain factors may cause the portfolio to track its target Index less closely, including if theadvisor selects securities that are not fully representative of the Index .