Transcription of Blood Gas Analysis - Academy of Neonatal Nursing
1 123 Acute Respiratory Care of the Neonate6 Blood Gas AnalysisDebbie Fraser, MN, RNC-NICB lood gas Analysis is one of the major tools in assessing the respiratory status of the newborn. To adequately use this information, one must have a basic understanding of gas transportation and acid -base physiology. These topics are addressed in this chapter to provide a basis for applying these principles to the inter-pretation of Neonatal Blood gases. Common terminology is defined in Table OF OXYGEN AND CARBON DIOXIDEOXYGENO xygen is used in aerobic reactions throughout the human body and is supplied to the tissues through the efforts of the respiratory and cardiovascular systems.
2 The lungs are responsible for bringing an adequate sup-ply of oxygen to the Blood . Control of this process occurs mainly in response to the effect of carbon dioxide (CO2) levels on receptors in the large arteries and the brain. At moderate to severe levels of hypoxemia, peripheral chemoreceptors take the dominant role in increasing ventilation, resulting in increased oxygen intake and lower than normal partial pressure of carbon dioxide in arterial Blood (PaCO2).1 The cardiovascular system regulates the oxygen sup-ply by altering cardiac output in response to the meta-bolic rate of peripheral tissues.
3 Distribution of oxygen to specific tissues is determined by local metabolic activity. Oxygen transport is affected by:2t partial pressure of oxygen in inspired airt alveolar ventilationt ventilation-to-perfusion matchingt arterial pH and temperaturet cardiac outputt Blood volumet hemoglobint hemoglobin s affinity for oxygenOxygen transport to the tissues can be divided into a three-phase process, involving oxygen diffusion from the alveoli to the pulmonary capillaries (external respira-tion) (phase 1), gas transport in the bloodstream (phase 2)
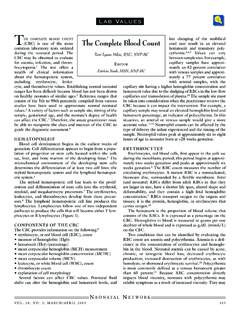
4 , and diffusion of oxygen from the capillaries to the cells (internal respiration) (phase 3). The first two phases are discussed diffuses from the alveoli to the pulmonary capillaries. Oxygen enters the lung during inspiration and diffuses across the alveolar-capillary membrane, depending on the concentration gradient of oxygen in the alveolus and the capillary (Figure 6-1). Factors that interfere with oxygenation at this point include a decrease in minute ventilation, ventilation-perfusion mismatch, and alterations in the alveolar-capillary in the Blood , oxygen must be transported to the tissues.
5 A small amount of oxygen (about 2 5 percent) is dissolved in the plasma; 95 98 percent is bound to hemoglobin. The total volume of oxygen carried in the Blood is termed the arterial oxygen content and reflects both the oxygen combined with hemoglobin and the amount dissolved in the smaller, dissolved portion of oxygen is measured as the partial pressure of oxygen (PaO2). Partial pressure refers to the force the gas exerts in the Blood . Through simple diffusion, gases move from an area of higher pressure to an area of lower pressure.
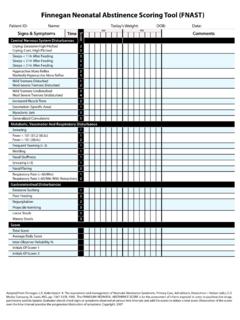
6 PaO2 is the most 6 Blood Gas Analysis ARC124important factor in determining the amount of oxygen bound to hemoglobin. As PaO2 increases, more oxygen diffuses into the red Blood cells, where it combines with hemoglobin to form hemoglobin molecule contains four atoms of iron and therefore can combine with four molecules of oxygen. When fully combined with oxygen, 1 g of hemo-globin carries mL of The combination of oxygen and hemoglobin is expressed as oxygen satura-tion: a measure of the hemoglobin sites filled divided by the sites available (Figure 6-2).
7 Oxygen-hemoglobin saturation is plotted on an S-shaped curve known as the oxyhemoglobin disso-ciation curve (see Figure 4-10); this curve is based on adult hemoglobin at normal temperature and Blood pH. Normal hemoglobin is 60 percent saturated at a PaO2 of 30 mmHg and 90 percent saturated at a PaO2 of 60 mmHg. At a PaO2 of 90 mmHg, 95 percent of hemo-globin is saturated with the low PaO2 values seen on the steep slope of the curve in Figure 4-10, a small increase in PaO2 results in a large increase in oxygen saturation. Conversely, on the flat upper portion of the curve, a large increase in PaO2 results in only a small increase in saturation.
8 Hemoglobin cannot be more than 100 percent satu-rated, but PaO2 can exceed 100 mmHg. At a PaO2 of >10 0 m m H g , O2 saturation cannot reflect PaO2. For this reason, PaO2 is a more sensitive indicator of high oxygen levels in the Blood than is the measurement of factors change the affinity of hemoglobin for oxygen, shifting the curve to the left or to the right (see Figure 4-10). Alkalosis, hypocarbia, hypothermia, decreased amounts of 2,3-diphosphoglycerate (2,3-DPG), and the presence of fetal hemoglobin all shift the curve to the An organic phosphate, 2,3-DPG is produced as a by-product of red cell metabolism.
9 It binds with hemo-globin and decreases its oxygen a shift to the left, there is an increased affinity between oxygen and hemoglobin; therefore, hemoglobin more easily picks up oxygen and doesn t release it until the PaO2 level falls. This can impede oxygen release to the tissues, but enhances uptake of oxygen in the , hypercapnia, hyperthermia, increased 2,3-DPG, and the presence of mature, or adult, hemo-globin move the curve to the A shift to the right causes oxygen to bind less tightly to hemoglobin and to release from hemoglobin at higher levels of PaO2, thereby enhancing oxygen unloading at the tissue : An easy way to remember how shifts in the curve affect oxygen delivery is to think of it this way.
10 Left on the hemoglobin, right into the DIOXIDEBody cells produce CO2 as a by-product of metabolism. Carbon dioxide diffuses from the cells down a concentra-tion gradient, from areas of high partial pressure of CO2 to areas of low partial pressure of CO2. A small amount (8 percent) travels dissolved in the plasma; another small portion (2 percent) is transported in the plasma bound to proteins, forming carbamino The remain-der is transported within the red Blood red Blood cells, about 10 percent of the CO2 forms carbamino compounds by combining with amino acids contained in the globin portion of the hemoglobin.