Transcription of Boiling points of mixtures - South Wolds Academy
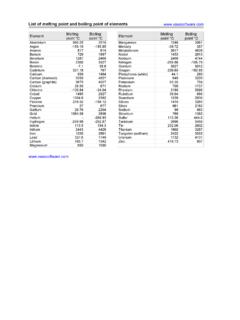
1 8Ge(7) Boiling points of mixtures The table on the right shows the Boiling points of water, % of % of Boiling ethanol (alcohol) and mixtures of the two liquids. ethanol water point ( C). Use the data in the table to answer the following 100 0 78. questions. 90 10 79. 80 20 82. 70 30 85. 60 40 90. 50 50 92. 40 60 94. 1 What is the Boiling point of pure ethanol? 8. 2 What is the Boiling point of pure water? 30 70 96. G. 3 What is the mean (average) of these two temperatures? 20 80 98. e 10 90 99. 4 What is the Boiling point of the mixture that contains 0 100 100. half ethanol and half water? 5 Would you have expected the answers to questions 3. and 4 to be the same? Explain why. 6 Plot a graph of Boiling point (y-axis) against percentage of water in the mixture (x-axis).
2 Temperature % water 7 Join the points with a single smooth line. Describe the shape of the line. 8 Write a sentence to describe the trend in the Boiling point when more and more water is added to the ethanol. 9 Use your graph to estimate the temperature at which a mixture containing 75% ethanol would boil. Optional extra 10 In the old days, before there were accurate measuring instruments, customs officers who were trying to catch smugglers used to estimate the purity of alcohol using gunpowder. See if you can find out about proof spirit' and how the gunpowder test worked. I use information from text and graphs present data as a line graph carry out research on my own. Exploring Science edition 355 Pearson Education Limited 2008. 355 21/8/08 14:40:24.