Transcription of Bomb Calorimetry and Heat of Combustion
1 UC Berkeley College of ChemistryChemistry 125 Physical Chemistry LaboratoryBomb Calorimetry and heat ofCombustionAuthor:JonathanMelvilleColla borators:DavidGygiand EffieZhouGraduate Student Instructor:MariekeJagerNovember 7, 20141 AbstractIn this experiment we used a Parr bomb calorimeter to accurately determine the heatof Combustion of a sample of sugar. By carefully controlling the pressure, heat flow,and contents of our bomb, and by using a sample of benzoic acid with known valuesto calibrate, we were able to calculate a value for cH sucroseof 1108000 2000calmol,reasonably close to the literature value of -1156000calmol[1]. Mathematically, a majority ofour uncertainty can be traced back to the calculation of a relatively smallCofrom a largerCtotal, maintaining the absolute error but greatly increasing the relative error. Most ofthe original error can be traced back to uncertainty in the quality of the fits of the fore-and afterdrift, as the original masses of sample and length of fuse wire both contributeonly minimally to the final error.
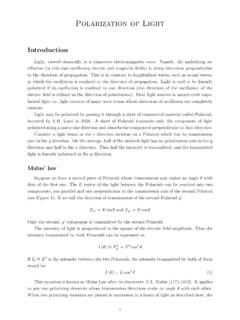
2 Nevertheless, we received a fairly accurate measurementwith good precision (especially considering how rudimentary our experimental setup iscompared to one you might find at NIST), validating this IntroductionCalorimetry is an important field of analytical chemistry which deals accurately mea-suring heats of reaction and finds application in fields ranging from nutritional analysisto explosive yield tests. The need for increasingly accurate reference measurements andthe limited effects of experimental technique mean that more advanced instrumentationis often the single best way to improve calorimetric accuracy in precision. This bringsus to the ParrTMModel 1108 Oxygen Combustion Vessel (Figure 1 or, as it will becolloquially referred to in this text, the Parr Bomb .The Parr Bomb is a bomb calorimeter, a type of constant-volume calorimeter (asopposed to typical styrofoam-cup calorimeters, which are constant-pressure calorimeters,at least in theory).)
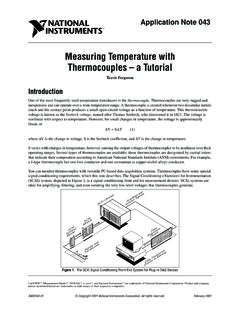
3 As seen in Figure 2, a bomb calorimeter typically consists of ametal bomb designed to withstand heat and pressure, a large Dewar flask to hold thebomb and a known volume of water, a means of remotely igniting the sample (typicallyelectrically, through the use of a fuse wire), and a means of accurately measuring the1 Figure 1:A ParrTMModel 1108 Oxygen Combustion Vessel , as used in this of the water. Because UC Berkeley is nothing if not a wealthy and generousinstitution, the Parr bomb used for this experiment came with a number of additionalfrills and features, including a pellet press to compress the sample into a compact formand the ability to fill the bomb with compressed oxygen, both of which ensure thatcomplete and total Combustion of the sample occurs. The sealed bomb acts as a closedsystem, and the energy from the adiabatic Combustion of a known mass of sample willheat the bomb calorimeter and the water a measurable amount.
4 Through the use of acalibration sample of known Combustion value (often benzoic acid[2], including here), theheat capacity of the calorimeter system can be determined, allowing for the calculationof the heat of Combustion of a sample of known mass by the net temperature change andthe heat capacities of the combined water-calorimeter system. To aid in calculation, afuse wire with standardized heat of Combustion per unit length can be used1[3], and asmall quantity of water can be inserted into the bomb in advance (to ensure that watervapor is saturated in the bomb, such that the heat of vaporization of water does not needto be factored in).In addition to its use in Calorimetry , the reliability and efficacy of this oxygen-bomb method has led to its use as thede factoprocedure for measuring heteroatoms like sulfur,1In this experiment, ParrTM45C10 Fuse Wire with a heat of Combustion of 2:A cutaway diagram of a typical bomb calorimeter.
5 [5]chlorine, arsenic, and many other elements in a broad range of combustible materials,including coal, coke, petroleum, and petroleum products[4].In this experiment, we measured the heat of Combustion of sucrose:C12H22O11(s) + 12O2(g) 12CO2(g) + 11H2O(l), cH = 1108365calmol[1]3 ProcedureThis experiment proceeded through several discrete steps. Measurement of sample tem-perature was conducted through an integrated Computer Data Acquisition System knownas labview . A subroutine to monitor and record the temperature was created in this programming language , and interfaced with the instrument. Using the Parr pellet press(previously mentioned), compact samples were created and massed (in that order). Thepellets were placed inside the bomb and measured lengths of fuse wire were threaded intothe bomb, in contact with the samples. This data is compiled in the following table:SampleMass(g)Fuse length(cm)Benzoic Acid Acid 2 (failed) bomb was then sealed and tightened.
6 It was flushed twice with 10 atm of O2gasto purge N2(to preclude the formation of nitric acid), then filled with 25 atm of bomb was placed in the calorimeter, which was then filled with precisely 2000. mLof water. The cover was sealed, a stirrer was turned on, and the labview program was initiated. After some waiting some time to establish a baseline level of temperature,the sample was remotely ignited. Once the temperature had equilibrated and anotherbaseline reached, the bomb as removed from the calorimeter and vented, before beingcleaned and dried for the next is important to note that the second attempted trial of our unknown sample (Sucrose2) failed to ignite and was discarded, and a replacement run was not able to be made inthe interests of time. Raw data for this experiment is included in the Results section,but insufficient data was acquired for proper data workup.
7 As a result, only data fromthe Sucrose 1 trial was used in the calculations that Raw Temperature Data CalculationsSample calculations for the Benzoic Acid 1 sample (Figure 3) are provided. The restof the calculations were performed in Excel and will be provided on request. For thefollowing section,tis used to refer to a time point andTis used to refer to a Calculation of Tmidand tmidValues forTinitialandTfinalof C and C , respectively, were obtained viainspection. By this method, an estimation of T=Tfinal Tinitial= C . From here,Tmid=Tinitial+ T2= C gives us a rough value of the midpoint temperature. Byinspection, a value oftmidof 1403 (arbitrary units) was 3:A plot of temperature as a function of time for the Benzoic Acid 1 Regression fitting to find TBaseline curves were fit for the foredrift and afterdrift curves (Figures 4a and 4b on page 6)and regression curves were taken using a built-in least-squares function (LINEST).
8 Theforedrift equation wasT(x) = + ,and the afterdrift equation wasT(x) = + extrapolating these lines to our calculated value oftmid, a fairly accurate value for T= was obtained, since the slopes are very small (hence, there is little varia-tion) and our estimatedtmidis very close to the actual midpoint of the curve (a)Foredrift(b)AfterdriftFigure 4:Magnified portions of the Benzoic Acid 1 temperature-time plot, showing fitsfor foredrift and Calculation ofCandCoIt is already known that the total heat capacityC=mCH2O+Co, whereCH2 Ois thespecific heat capacity of water andCois the heat capacity of the calorimeter. The purpose6 Figure 5:A plot of temperature as a function of time for the Benzoic Acid 2 the benzoic acid trials, then, is to use the known heat of Combustion to determineCofromCandCH2O, to allow for accurate calculation of the heat output of the unknownsample (sugar).
9 Using a value ofCH2O= C, a density of H2O= 1gmL, and a knownvolume of 2000. mL of water,mCH2O= Ccan be determined. Meanwhile,the total heat capacityCcan be determined using the equationC= cH0m+e3 T,where cH0is the heat of Combustion of benzoic acid (given as -6318calg), m is themass of the benzoic acid sample ( g),e3is the heat of Combustion of the wire(calculable from the heat of Combustion of the wire, the length of the wire, cm), and Tis the previously calculated temperature rise, C . Combiningall these factors, we can find a value forCoof C, with a corresponding valueforCof C. Performing this calculation again for the second benzoic acid trialallows for calculation of average values ofCandCo(tabulated below), which can beused in conjunction with the Sucrose 1 data to provide a value of C from which the heat7(a)Foredrift(b)AfterdriftFigure 6:Magnified portions of the Benzoic Acid 2 temperature-time plot, showing fitsfor foredrift and Combustion can be determined through the exact same process in reverse, and thedifference between energy and enthalpy can be accounted for by factoring in the effects8 Figure 7:A plot of temperature as a function of time for the Sucrose 1 the (negligible in practice)PVterm, using the following equation: H= U+ (PV),where (PV) = (n2 n1) Tabulated results and uncertaintiesVariableValueError(abs.)
10 Error(rel.) cU cH cH sucrose(lit.)-1108365calmol % 9(a)Foredrift(b)AfterdriftFigure 8:Magnified portions of the Sucrose 1 temperature-time plot, showing fits forforedrift and error ranges and propagation calculations are available via Excel spreadsheeton 9:A plot of temperature as a function of time for the failed Sucrose 2 DiscussionFrom comparing the contribution of the (PV) term (equal to the difference between the cH sucroseand cU sucroseterms, approximately 1000calmol), we note that the magnitude ofthe uncertainty (2470calmol) is greater than the entire (PV) , the error produced by a lack of knowledge of the specific heat of the sampleis dwarfed by other sources of uncertainty in the the temperature fits to find T. Werethe uncertainty in specific heat the only form of error in the sample, our error would besome hundred times smaller than our actual calculated H T1term pertains to the initial temperature, as we circumvented the finalequilibration ofTftoTiby taking into account the U=mc Tterm.