Transcription of Boston Area Economic Summary - Bureau of Labor Statistics
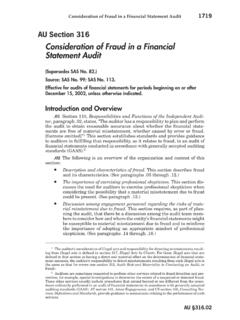
1 Updated February 10, 2023 Average weekly wages for all industries by countyBoston area, second quarter 2022( = $1,294; Area = $1,770)Source: BLS, Quarterly Census of Employment and Summary presents a sampling of Economic information for the area; supplemental data are provided for regions and the nation. Subjects include unemployment, employment, wages, prices, spending, and benefits. All data are not seasonally adjusted and some may be subject to revision. Area definitions may differ by subject. For more area summaries and geographic definitions, see , MA-NH, Area Economic SummaryUnemployment rates for the nation and selected areasOver-the-year changes in employment on nonfarm payrolls and employment by major industry city, MANewton city, MACambridge city,MABoston city, MABoston areaUnited StatesDec-21 Dec-22 Source: BLS, Local Area Unemployment areaUnited StatesSource: BLS, Current Employment percent changes in employmentNumberPercentTotal nonfarm2, , logging, and , transportation, and and business and health and : BLS, Current Employment 2022 Change from Dec.
2 2021 to Dec. 2022 Boston area employment(number in thousands)Over-the-year change in the prices paid by urban consumers for selected categoriesOver-the-year changes in the selling prices received by producers for selected industries nationwideAverage hourly wages for selected occupationsOver-the-year changes in wages and salariesNew England Information Office 646-264-3600 Average annual spending and percent distribution for selected categoriesEmployer costs per hour worked for wages and selected employee benefits by geographic itemsFoodEnergyBoston city averageSource: BLS, Consumer Price percent change in CPI-U, November freight truckingHospitalsSecurity, commodity contracts and like activitySource: BLS, Producer percent changes in PPI$30,999$22,046$9,611$10,398$11,156$7, 803$6,922$5,316$11,752$7,562$20,283$11,0 620%20%40%60%80%100% Boston areaUnited StatesAll other itemsPersonal insurance & pensionsHealthcareFoodTransportationHous ingAverage annual expenditures, United States and Boston area, 2020-21 Source: BLS, Consumer Expenditure areaUnited StatesAl l occupati ons$ $ and operati ons ochemi s ts and bi ophys i ci s anal ys s tered nurs and audi : BLS, Occupational Employment and Wage Statistics , May industry,September 2022 New England (1)United StatesTotal compens ati on$ $ Wages and s al ari Total benefi Pai d l Vacati Suppl emental Ins Reti rement and s avi Legal l y requi red benefi.
3 BLS, Employer Costs for Employee Compensation.(1) The states that compose the New England census division are: CT, ME, MA, NH, RI, and areaUnited StatesSource: BLS, Employment Cost percent changes in ECI