Transcription of Boulder Growth & Income Fund BIF - funddata.com
1 Page 1 of 3 | Morningstar Factsheets | All data as at 24 May 2018 unless stated otherwise Boulder Growth & Income fund BIF The factbook pages are compiled by Morningstar and have no regard to the particular needs of any specific recipient. All price information is indicative only. Nothing herein is to be construed as a solicitation or an offer to buy or sell any financial products. The factbook pages are prepared by Morningstar and based on information obtained from sources believed to be reliable but are not guaranteed as being accurate, nor are they a complete statement of these securities. Morningstar accepts no liability whatsoever for any loss or damage of any kind arising out of the use of all or part of these factbook pages.
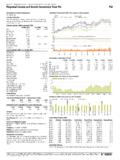
2 Morningstar Peer Group Classification Morningstar US US General Equity P Investment Objective The fund seeks long term capital appreciation and current Income through investment in equity and fixed Income US securities Valuation 24 May 201812m High & Low Price $ $ / $ NAV $ $ / $ Discount / Peer Group Discount Z-Statistic1 Inception Date 07 Dec 1972 Exchange NY Stock Exchange NAV Ticker XBIFX Total Assets $1, Net Assets $1, Market Capitalization $1, Common Shares Outstanding 106,096,817 Preferred Shares Amount $- Total Leverage Ratio2 4% 1940 Act Leverage Ratio3 4% Non-1940 Act Leverage Ratio4 0% Average Daily Shares Traded (1yr) Average Daily Value Traded (1yr) $ Total Expense Ratio5 (-) - Income -only Rate (Price)
3 6 Inc & Cap Gains Rate (Price)7 Total Distribution Rate (Price)8 Latest Distribution Cover10 N/A Latest UNII per share11 $ Distribution Policy The fund pays Monthly distributions under a managed distribution policy Latest Distribution History12 Ex-Date Income S/T Cap L/T Cap Tot Cap Rtn CapTotal23 Jul 2018 21 Jun 2018 22 May 2018 20 Apr 2018 21 Mar 2018 20 Feb 2018 23 Jan 2018 20 Dec 2017 21 Nov 2017 23 Oct 2017 21 Sep 2017 22 Aug 2017 Asset
4 Class (% Total Assets) as at 31 May 2017 Equity - Listed Short-Term Invst. Investment Funds Cash Alternatives Total Return Performance over 5 years (or since inception) Performance (Total Return%13) (Annualized) 1 W 1 Mo3 Mo6 MoYTD1 Yr3 Yr5 YrPrice + + + + + + + + + + Group (Price) + + + + + + + + Group (NAV) + + + + + + + + + + + + + + : S&P 500 Composite fund distributions reinvested on ex-dividend date8 Distribution Rates over 5 years (or since inception) Distributions ($) over 5 years (or since inception) Distribution History by Calendar Year12 Year IncomeS/T CapL/T CapTot CapRtn CapTotal2018 2017 2016 Page 2 of 3 | Morningstar Factsheets | All data as at 24 May 2018 unless stated otherwise Boulder Growth & Income fund BIF The factbook pages are compiled by Morningstar and have no regard to the particular needs of any specific recipient.
5 All price information is indicative only. Nothing herein is to be construed as a solicitation or an offer to buy or sell any financial products. The factbook pages are prepared by Morningstar and based on information obtained from sources believed to be reliable but are not guaranteed as being accurate, nor are they a complete statement of these securities. Morningstar accepts no liability whatsoever for any loss or damage of any kind arising out of the use of all or part of these factbook pages. Largest Holdings (% Portfolio) as at 31 Mar 2018 Berkshire Hathaway Inc A JPMorgan Chase & Co Berkshire Hathaway Inc B Cisco Systems Inc Caterpillar Inc.
6 Yum Brands Inc Wells Fargo & Co Wal-Mart Stores Inc Pfizer Inc Cohen & Steers Infrastructure Common Risk & Return Latest Earnings for 6m to 30 Nov 2017 EPS Pre-Prefs distributions, p/m $ EPS Post-Prefs distributions, p/m $ Last Distribution ( Income ), p/m $ Last Distribution (Inc & Cap Gns), p/m $ Last Distribution (Inc, Cap Gns & Rtn Cap), p/m $ Earnings Rate16 Distribution Cover10 N/A UNII per Share (30 Nov 2017) $ Expected Life of UNII (months)17 n/a Latest Capital Gains for 6m to 30 Nov 2017 Realized Cap Gains per share p/m $ Cap Gains per share p/m $ Reserves as at 30 Nov 2017 Accumulated Unrealized Capital Gains per share $ Unrealized Cap Gains/Current NAV18 54%Management Fees Monthly Advisor fee calculated on average monthly net assets at annual rate of fund Manager Details fund Manager: Brendon Fischer (06 Feb 2012) / Stewart R.
7 Horejsi (30 Aug 1999) / Joel Looney (01 Oct 2013) Rocky Mountain Advisers, LLC Boulder Telephone: Website: Initial Public Offering at USD on 07 Dec 1972 Sector Breakdown (% of total assets) Geographic Breakdown (% of total assets) Risk & Correlation 3 Mo6 Mo1 Yr3 Yr5 Yr Alpha (NAV)19 Beta (NAV)20 R-squared (NAV)21 Sharpe (NAV)22 Price Volatility23 1516131312 NAV Volatility23 1516121312 Benchmark Volatility23 1616121312 Peer Group Price Volatility23 1213101211 Peer Group NAV Volatility23 1313101212 Benchmark.
8 S&P 500 Composite Discrete Monthly NAV Total Return % Additional Performance (Cumulative, Non-Annualized) Total Return %13 Period PriceNAVPG PricePG NAV FD B mark + + + + + + + + + + + + + + + + + + + + + + + + Inception (07 Dec 1972) - + + S&P 500 Low (5 Mar 09) + + + + + Sub-Prime Crisis (20 Nov 07) + + + + + Notes The factbook pages are compiled by Morningstar and have no regard to the particular needs of any specific recipient.
9 All price information is indicative only. Nothing herein is to be construed as a solicitation or an offer to buy or sell any financial products. The factbook pages are prepared by Morningstar and based on information obtained from sources believed to be reliable but are not guaranteed as being accurate, nor are they a complete statement of these securities. Morningstar accepts no liability whatsoever for any loss or damage of any kind arising out of the use of all or part of these factbook pages. 1 Z-Statistic 1y shows whether the fund s current discount is significantly higher or lower than the average over the past year, calculated as (Current Discount Mean) / Std Dev 2 Total Leverage Ratio is a measure of how leveraged the fund is by the use of all types of leverage instruments.
10 It is calculated by dividing the sum of the fund s leverage (includes Preferred Shares, Loans, Lines of Credit, Notes Payable/Commercial Paper, Tender Option Bonds, Reverse Repurchase Agreements, Securities Lending and Dollar Rolls) by the fund s Total Assets. 3 1940 Act Leverage Ratio is a measure of how leveraged the fund is by the use of instruments classed as leverage under the 1940 Investment Company Act. It is calculated by dividing the sum of the fund s leverage in the form of Preferred Shares, Loans, Lines of Credit, Notes Payable & Commercial Paper, by the fund s Total Assets minus non-1940 Act Leverage. 4 Non-1940 Act Leverage Ratio is a measure of how leveraged the fund is by the use of instruments that are not classed as leverage under the 1940 Investment Company Act.