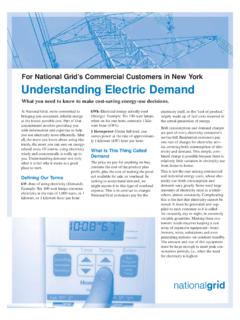
Transcription of bp Statistical Review of World Energy 2020
1 Statistical Review of World Energy2020 | 69th editionDiscover more onlineAll the tables and charts found in the printed edition are available at plus a number of extras, including: The Energy charting tool view predetermined reports or chart specific data according to Energy type, region, country and year. Historical data from 1965 for many sections. Additional country and regional coverage for all consumption tables. Additional data for refined oil production demand, natural gas, coal, hydroelectricity, nuclear Energy and renewables. PDF versions and PowerPoint slide packs of the charts, maps and graphs, plus an Excel workbook and database format of the the bp World Energy appExplore the World of Energy from your tablet or smartphone. Customize charts and perform the calculations. Review the data online and offline.
2 Download the app for free from the Apple App Store and Google play 66 years, the BP Statistical Review of World Energy has provided high-quality objective and globally consistent data on World Energy markets. The Review is one of the most widely respected and authoritative publications in the field of Energy economics, used for reference by the media, academia, World governments and Energy companies. A new edition is published every more onlineAll the tables and charts found in the latest printed edition are available at plus a number of extras, including: The Energy charting tool view predetermined reports or chart specific data according to Energy type, region, country and year. Historical data from 1965 for many sections. Additional data for refined oil production demand, natural gas, coal, hydroelectricity, nuclear Energy and renewables.
3 PDF versions and PowerPoint slide packs of the charts, maps and graphs, plus an Excel workbook of the data. Regional and country factsheets. Videos and OutlookWatch the BP Energy Outlook 2017 video, containing our projections of long-term Energy trends to 2035. Download the booklet and presentation materials at the conversation#BPstatsDownload the BP World Energy appExplore the World of Energy from your tablet or smartphone. Customize charts and perform the calculations. Review the data online and offline. Download the app for free from the Apple App Store and Google play data series for proved oil and gas reserves in BP Statistical Review of World Energy June 2017 does not necessarily meet the definitions, guidelines and practices used for determining proved reserves at company level, for instance, as published by the US Securities and Exchange Commission, nor does it necessarily represent BP s view of proved reserves by country.
4 Rather, the data series has been compiled using a combination of primary official sources and third-party Statistical Review of World Energy analyses data on World Energy markets from the prior year. The Review has been providing timely, comprehensive and objective data to the Energy community since Statistical Review of World Energy 2020 Contents Introduction 2 Chief executive officer s introduction 3 2019 at a glance 4 The year in Review Primary Energy 8 consumption 9 consumption by fuel 11 consumption per capitaCO2 Carbon 13 Carbon dioxide emissions Oil 14 Reserves 16 Production 20 consumption 26 Prices 28 Refining 30 Trade movements Natural gas 32 Reserves 34 Production 36 consumption 39 Prices 40 Trade movements Coal 44 Reserves 46 Production 47 consumption 49 Prices and trade movements Nuclear Energy 50 consumption Hydroelectricity 51 consumption Renewable Energy 53 Renewables consumption 55 Generation by source 56 Biofuels production 57 Biofuels consumption electricity 59 Generation 61 Generation by fuel Key minerals 62 Production 63
5 Reserves 63 Prices Appendices 64 Approximate conversion factors 64 Methodology 65 Definitions 65 More informationMethodologyThis year we have made the following two methodological changes: first, Energy units have been changed from million tonnes of oil equivalent to exajoules. Second, the method for estimating primary Energy consumption of non-fossil sources of electricity , has been revised. This is still based on an input-equivalence method, on the amount of fuel that would be required by a standard thermal power station to generate the reported electricity output. However the thermal efficiency assumed for that standard power plant is no longer fixed. The efficiency assumption rises each year to better reflect real World improvements in the average power station thermal efficiency. For more details see the appendix, or visit: Statistical Review of World Energy 2020 Chief executive officer s introductionThat compares with just 10% provided by renewable Energy .
6 Renewables will need to grow even more strongly over the next three decades to decarbonize the power worrying is the trend for carbon emissions. The slowing in the growth of carbon emissions to in 2019 may suggest some grounds for optimism. But this deceleration needs to be seen in the context of the big increase in carbon emissions in 2018 of The hope was that as the one-off factors boosting carbon emissions in 2018 unwound, carbon emissions would fall significantly. That fall did not happen. The average annual growth in carbon emissions over 2018 and 2019 was greater than its 10-year average. As the World emerges from the COVID-19 crisis it needs to make decisive changes to move to a more sustainable disruption to our everyday lives caused by the lockdowns has provided a glimpse of a cleaner, lower carbon World : air quality in many of the World s most polluted cities has improved; skies have become clearer.
7 The IEA (International Energy Agency) estimate that global CO2 emissions may fall by as much as gigatonnes this year. That has come at considerable cost and as economies restart and our lives return to normal there is a risk that these gains will be lost. But to get to net zero by 2050, the World requires similar-sized reductions in carbon emissions every other year for the next 25 years. This can be achieved only by a radical shift in all our behaviours. By using resources and Energy more efficiently. And by implementing the full range of zero and low carbon energies and technologies at our disposal including renewable energies, electrification, hydrogen, CCUS (carbon capture use and storage), bioenergy and many more. These technologies exist today the challenge is to use them at pace and bp, we are committed to playing our part.
8 In February, we adopted a new purpose to reimagine Energy for people and our planet. And we announced a new ambition, to be a net zero company by 2050 or sooner and to help the World get to net zero. The experience of COVID-19 has only reinforced our commitment to this purpose and ambition, by highlighting both the fragility of our planet and the opportunities it provides to truly build back better. As bp along with the rest of the World navigate the Energy transition, we will need timely, objective and comprehensive data on the global Energy system. That is the role that the Statistical Review has been playing for the past 69 years and will continue to play in the future. I hope this year s Statistical Review is useful to everyone else seeking ways to get to net zero and build back better. And I would like to thank the very many people who help our economics team in compiling it, including the governments and Statistical agencies around the World who have contributed their official data again this year.
9 The Statistical Review would not be possible without your generous co-operation and transparency. Thank LooneyChief executive officerJune 2020 The COVID-19 pandemic may well turn out to be the most tragic and disruptive event that many of us will ever live through. As I write this in the middle of June over 400 thousand people globally have lost their lives to the infection. Millions more might have done so without the widespread lockdown of economies across the World , which came at huge economic and social combined health and economic shock is bound to reshape the global economic, political and social environment in which we all live and work. It has the potential to accelerate emerging trends and create opportunities to shift the World onto a more sustainable path. But it also risks slowing progress if the short-term, domestic issues raised by COVID-19 are prioritized over long-term, global challenges, such as climate change.
10 It feels like the World is at a pivotal moment: it needs to address these short-term concerns but in a way that builds back technologies required to reach net zero exist today the challenge is to use them at pace and scale, and I remain optimistic that we can make this happen. In that context, this year s edition of bp s Statistical Review of World Energy provides a timely reminder of global Energy trends prior to the crisis. Some aspects are encouraging particularly the continuing strong growth of renewable Energy . Led by wind and solar power, renewable Energy increased by a record amount, accounting for over 40% of the growth in primary Energy in 2019. At the same time, coal consumption fell for the fourth time in the past six years, with its share in the global Energy mix falling to its lowest level for 16 other aspects of the Energy system continued to give cause for concern.