Transcription of Brochure: Effective Carbon Rates 2021 - OECD
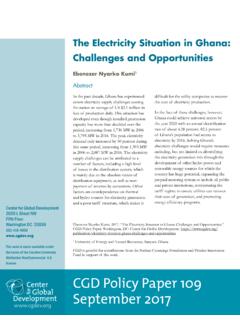
1 Effective Carbon Rates 2021. INTRODUCTION. Introduction Effective Carbon Rates 2021 is the most detailed and comprehensive account of how 44 OECD and G20 countries responsible for around 80% of global Carbon emissions price Carbon emissions from energy use. The Effective Carbon rate is the sum of tradeable emission permit prices, Carbon taxes and fuel excise taxes, all of which result in a price on Carbon emissions (Figure 1). This brochure summarises the main results of the report Effective Carbon Rates 2021. 2 . OECD Effective Carbon Rates 2021. Carbon PRICING. Why price Carbon emissions? 73 %. Carbon pricing is a very Effective decarbonisation One practical example is the policy. Carbon prices reduce emissions by making Carbon price support in the low- and zero- Carbon energy more competitive United Kingdom, which increased compared to high- Carbon alternatives, and by Effective Carbon Rates in the encouraging reduced use of Carbon containing fuels.
2 electricity sector from EUR 7 per In addition, a strong commitment to Carbon prices tonne of CO2 to more than EUR 36 between 2012 and creates certainty for investors that it pays to invest 2018. Emissions in the electricity sector in the country in the use of available clean technologies and the fell by 73% in the same period,2 suggesting a strong development of new ones. response of UK utilities to higher Effective Carbon Rates . It is estimated that an increase in the Effective Carbon Another practical example concerns the European Union rate by EUR 1 per tonne of CO2 leads on average to a Emissions Trading System (EU ETS). From 2018 to 2019, reduction in emissions over This means permit prices in the EU ETS increased by EUR per that, for a country that starts with no Carbon price tonne of CO2, from about EUR 16 to EUR At the same at all, the introduction of a Carbon tax of EUR 10 time, overall emissions in the EU ETS decreased by ,4.
3 Per tonne of CO2 on its entire energy base would be illustrating a significant short-term response of energy expected to reduce emissions by an estimated utilities covered by the EU ETS to higher permit prices. Figure 1: Components of Effective Carbon Rates Effective Carbon Rate (EUR/tCO2). 1. Sen, S., & Vollebergh, H. (2018). The effectiveness of taxing the Carbon content of energy consumption. Journal of Environmental Economics and Management, 92, 74-99. Emission permit price 2. UK Department for Business, Energy and Industrial Strategy (2020). Updated energy and emissions projections: 2018 - Projections of greenhouse gas Carbon tax emissions and energy demand from 2018 to 2035. 3. ICAP (2020). International Carbon Action Partnership (ICAP) ETS Prices. Retrieved on 13 October 2020 from Fuel excise tax prices. 4. Marcu, A. et al. (2020). 2020 State of the EU ETS Report. ERCST, Wegener Center, Bloomberg NEF and Ecoact.
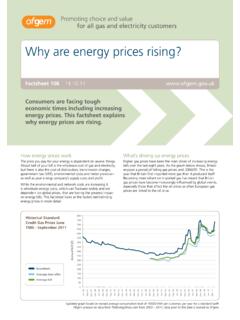
4 Source: Effective Carbon Rates 2021. OECD Effective Carbon Rates 2021 . 3. MEASURING PROGRESS. Measuring progress with Carbon pricing The Carbon Pricing Score (CPS) measures the extent to This means that, together, they reached 19% of the goal which countries have attained the goal of pricing all of pricing all emissions at EUR 60 or more per tonne energy related Carbon emissions at certain benchmark of CO2; see the area shaded in light blue in Figure 2. values for Carbon costs. The more progress that a country The area shaded in dark blue shows the Carbon Pricing has made towards a specified benchmark value, the higher Gap60, the shortfall between the current Carbon the CPS. For example, a CPS of 100% against a EUR 30 per Pricing Score and pricing all emissions at or greater than tonne of CO2 benchmark means that the country (or the EUR 60 per tonne of CO2. In 2018, the Carbon Pricing Gap group of countries) prices all Carbon emissions in its (their) was 81%.
5 Territory from energy use at EUR 30 or more. A CPS of 0%. means that the country does not impose a Carbon price on Stronger progress had been made towards the any emissions at all. An intermediate CPS between 0% and more moderate EUR 30 per tonne of CO2 benchmark, 100% means that some emissions are priced, but that not however, the Carbon Pricing Score (CPS30) was still just all emissions are priced at or above the benchmark price. under a quarter (24%). Considering the more ambitious Similarly, a CPS of 100% against a EUR 60 per tonne of CO2 and forward-looking central Carbon pricing benchmark or EUR 120 CPS means that all emissions are priced at a of EUR 120 in 2030, the Carbon Pricing Score (CPS120). level that equals or exceeds the benchmark of EUR 60 or was only 12%, on average across the 44 countries EUR 120 per tonne CO2. in 2018. 19 %. In 2018, the 44 OECD and G20 countries analysed, which are responsible for about 80% of energy related global CO2 emissions, had a Carbon Pricing Score of 19% at the EUR 60.
6 Benchmark (CPS60). BOX 1. Carbon PRICING BENCHMARKS. Aiming to limit global temperature increases to C, as called 3. EUR 120 per tonne of CO2, a central estimate of the Carbon for in the Paris Agreement, requires decarbonisation by about price needed in 2030 to decarbonise by mid-century under the ,6 Against this background, Effective Carbon Rates assumption that Carbon pricing plays a major role in the overall 2021 employs three Carbon price benchmarks: decarbonisation effort (See Figure 2 , low complementary policies in Kaufman et al. (2020)). EUR 120 is also more in line 1. EUR 30 per tonne of CO2, a historic low-end price with recent estimates of overall social Carbon costs. benchmark of Carbon costs in the early and A. Carbon price of EUR 30 in 2025 is also consistent with a slow 5. Rogelj, J. et al. (2018). Mitigation Pathways Compatible with C in the Context of Sustainable Development. In V.
7 Masson-Delmotte et al. (Eds.), Global Warming decarbonisation scenario by 2060 according to Kaufman et al of C. An IPCC Special Report on the impacts of global warming of C. IPCC. (2020).8 6. Rogelj, J. et al. (2015). Energy system transformations for limiting end-of-century warming to below C. Nature Climate Change, 5, 519-527. 2. EUR 60 per tonne of CO2, a low-end 2030 and mid-range 7. Alberici, S. et al. (2014). Subsidies and Costs of EU Energy Final Report and Annex 3. Ecofys. 2020 benchmark according to the High-Level Commission 8. Kaufman, N. et al. (2020). A near-term to net zero alternative to the social cost of on Carbon A Carbon price of EUR 60 in 2030 is also Carbon for setting Carbon prices. Nature Climate Change. consistent with a slow decarbonisation scenario by 2060 9. High-Level Commission on Carbon Prices. (2017). Report of the High-Level according to Kaufman et al (2020). Commission on Carbon Prices.
8 World Bank, Washington, 4 . OECD Effective Carbon Rates 2021. MEASURING PROGRESS. BOX 2. THE STRENGTH OF Carbon PRICING VARIES ACROSS SECTORS. In the road sector, in 2018, the CPS60 was 80%, the CPS30 In the electricity sector, for all countries together, the CPS60 was was 91%, while the CPS120 stood at 58%. In the case of road 5%, the CPS30 was 10% and the CPS120 was 3% in 2018. However, transport, it is important to acknowledge that there are other some countries achieved significantly higher Carbon pricing external costs of road usage (such as accidents, noise, local air scores in the electricity sector. Both Korea and Iceland reached a pollution and congestion) in addition to the climate costs. Thus, CPS30 of 93%, and the United Kingdom scored 77% in 2018. All there are good reasons for charging Effective Carbon Rates that three countries also attained a CPS60 of nearly 50%. are substantially higher than low-end and mid-point estimates of climate costs in the road sector.
9 In 2018, in the industry sector the CPS60 was 5%, the CPS30. was 9%, and the CPS120 was 3% for all the countries together. Table 1: Progress varies significantly across sectors, 2018. Norway, Slovenia and Korea reached a CPS60 of 33% and a CPS30. Sector EUR 30 EUR 60 EUR 120 of 50% or more. Agriculture 43% 38% 23% In the residential and commercial sector, the CPS60 was 10% for & fisheries electricity 10% 5% 3% all 44 countries together in 2018. The CPS30 was 14% and the CPS120 was 6%. Some countries achieved a significantly higher Industry 9% 5% 3%. Carbon pricing level in the residential and commercial sector. The Off-road transport 34% 25% 13%. Netherlands reached a CPS60 of 89%, while Switzerland achieved Residential a CPS60 of 78% and Italy, France and Greece achieved a CPS60 of 14% 10% 6%. & commercial about 50%. Five countries achieved a CPS30 of more than 70%. Road transport 91% 80% 58%. (the Netherlands, Iceland, Switzerland, Korea and Ireland).
10 Source: Effective Carbon Rates 2021. Figure 2: The Carbon pricing score, 2018. 350. 300. Effective Carbon Rate in EUR per tonne of CO2. 250. Effective Carbon rate (EUR/t CO2). 200. 150. 100. EUR 60/t CO2 benchmark rate 50. 81% 19%. Carbon Pricing Gap Carbon Pricing Score (CPS). 0. 0 10 20 30 40 50 60 70 80 90 100. % of CO2 emissions from energy use Source: Effective Carbon Rates 2021. OECD Effective Carbon Rates 2021 . 5. THE Carbon PRICING SCORE. A handful of Carbon pricing leaders attained high Carbon pricing scores In 2018, Switzerland, Luxembourg and Norway reached electricity supply, significant taxes on fossil fuels used a CPS60 of close to 70%, as shown in Figure 3. In in the residential and commercial sector, as well as Switzerland, the high CPS60 is the result of fuel taxes a large share of industrial sector emissions resulting in the road sector that are fully earmarked for road from the offshore petroleum industry that is subject infrastructure purposes, a significant Carbon incentive to both a Carbon tax and the EU ETS.