Transcription of BUREAU INTERNATIONAL DES POIDS ET MESURES …
1 Final Report Page 1 BUREAU INTERNATIONAL DES POIDS ET MESURES Comparison of quantum hall effect resistance standards of the PTB and the BIPM on-going comparison Report on the 2013 on-site comparison Final Report July 2014 (1), (1), (1) tz (2) and (2) (1) BUREAU INTERNATIONAL des POIDS et MESURES , Pavillon de Breteuil, S vres, France. (2) Physikalisch-Technische Bundesanstalt, Bundesallee 100, Braunschweig, Germany. Final Report Page 2 Comparison of quantum hall effect resistance standards of the PTB and the BIPM On-going comparison 1 Introduction The comparison reported here is part of a BIPM programme to verify the INTERNATIONAL coherence of primary resistance standards by comparing quantum hall effect (QHE) based standards of the national laboratories with that of the BIPM. Five such comparisons have already been carried out in the period 1993 to 1999 with the BNM/LCIE (France) [1], the METAS (Switzerland) [2], the PTB (Germany) [3], the NPL (United Kingdom) [4] and the NIST (USA) [5].
2 A survey conducted by the BIPM in 2009 showed that a large number of NMIs are interested in participating in this programme, or in repeating the exercise. The BIPM therefore decided to start a new series of on-site comparisons, the first of them being the BIPM-PTB. 2 Principle of the comparison The comparison includes three parts: the calibration of a 100 standard resistor in terms of the Quantized hall resistance (QHR) standard of each laboratory, the scaling from 100 to 10 k and the scaling from 100 to 1 . The QHR value used is the conventional value RK-90. The relative difference in the calibrations of the standard resistor of nominal value R = 100 is expressed as (RPTB RBIPM) / RBIPM, where RBIPM and RPTB are the values attributed by the BIPM and the PTB respectively. The ratio K1 is defined as the ratio R10k /R100 of the resistance of two standards of nominal values 10 k and 100.
3 The relative difference in the measurements of K1 is expressed as (K1 PTB K1 BIPM) / K1 BIPM, where K1 PTB and K1 BIPM are the values attributed by the BIPM and the PTB respectively. Similarly, K2 is defined as the ratio R100 /R1 of the resistance of two standards of nominal values 100 and 1 . The relative difference in the measurements of K2 is expressed as (K2 PTB K2 BIPM) / K2 BIPM, where K2 PTB and K2 BIPM are the values attributed by the BIPM and the PTB respectively. All the results are reported with their associated standard uncertainty. The resistance value of each standard is defined as its four-terminal dc- resistance , the dc voltage to current ratio once any thermal emf across the resistor (in particular that induced by the Peltier effect [6, section ]) has reached a stable value . Experimental results reported here show that such specification can be difficult to meet, in particular for the 1 standards .
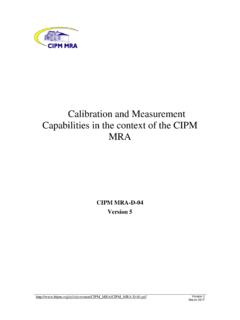
4 Figure 1 : Schematic of the on-site comparison performed at PTB in November 2013. The resistances to be compared are represented by rectangles, the resistance R or the ratios K to be determined by circles. Solid and dashed arrows stand for measurements with the BIPM s 1 Hz bridge or with PTB s CCC bridge, respectively. K1 K2 Final Report Page 3 3 The BIPM measurement system and the transfer standards A complete QHE standard was taken from the BIPM to the PTB. The BIPM s transportable QHE standard includes a cryostat containing a superconducting magnet and a low-temperature insert, a set of QHE samples mounted on a cryogenic probe and a room-temperature ac resistance ratio bridge operating at 1 Hz. The bridge is equipped with two room-temperature current comparators of nominal ratios 2065/16 and 1500/15. Three resistance standards of 1 , 100 and 10 k were also taken from the BIPM, to be used as common standards on the BIPM and the PTB measurement facilities.
5 They are fitted in temperature-controlled (25 C) individual enclosures. For these conventional standards , the differences between values measured at 1 Hz and at dc are small but not negligible. These differences have been determined at the BIPM prior to the comparison, using the BIPM cryogenic current comparator (CCC) operated at dc . They are applied as corrections to the measurements carried out at 1 Hz, meaning that the ac bridge is used as a transfer instrument referenced to the BIPM CCC. This method is preferable to transporting the BIPM CCC bridge itself since the ac bridge is a more rugged instrument, simple to operate, and much less sensitive to electromagnetic interference and temperature fluctuations. Furthermore, it provides resolution and reproducibility that are comparable to those of the BIPM CCC. The main possible sources contributing to the frequency coefficients listed in Table 1 are the QHR, the 1 Hz bridge, and the conventional standards .
6 At 1 Hz the frequency dependence of the QHR is assumed to be negligible [7] when compared with the uncertainty of the comparison, and the characterization of the bridge showed that the error at 1 Hz was smaller than 1 ppb. The frequency coefficients are therefore mainly related to the properties of the conventional standards . Table 1 : correction applied to the measurements carried out at 1 Hz (in relative terms). These values are specific to the three standards used in this comparison. The quantum hall samples used by the BIPM are GaAs-based heterostructures fabricated by the Laboratoire d Elelectronique Philips (LEP), of the same type as those used for previous on-site comparisons and for the comparison of quantized hall resistance in GaAs and in graphene at NPL in 2010 [8]. A detailed description of the BIPM QHE facility and of the three conventional standards can be found in [1] [9] [10].
7 The BIPM uncertainty budget for the measurement of the three resistance ratios is summarized in Table 2. resistance ratio Rel. corr. 1 Hz- dc / 10-6 Standard uncertainty / 10-9 RH(2) / 100 10 000 / 100 100 / 1 Final Report Page 4 Table 2 : BIPM uncertainty budget for the measure-ment of the three resistance ratios. 4 The PTB measurement system The re-designed PTB measurement bridge (replacement of the previous version used in [3]) is based on a 12-bit CCC with 18 windings having an overall of 4647 turns [11] and a PC-controlled electro-nics module. The latter comprises a digital double-current source, an improved bridge-voltage detector [12] and a binary compensation unit [13]. Table 3 summarizes the main parameters chosen for the three resistance comparison settings along with the respective type-B uncertainty contributions. Parameters resistance Ratio (Primary / Secondary resistance ) RH(2) / 100 10 k / 100 100 / 1 Numbers of turns N1 / N2 4001 / 31 4100 / 41 200 / 2 Voltage drop (I2R2) in Vpk-pk Compensation ratio k 10-2 10-2 10-3 Relative standard uncertainty contributions / 10-9 / 10-9 / 10-9 CCC windings ratio [a] Compensation ratio k [b] Bridge voltage U measurement (w/o type-A) Voltage drop (I2R2) measurement < Leakage resistances [c] < Correction of RH(2) for finite dissipation not applied not applied Combined type-B std.
8 Uncertainty uB = Table 3: Parameters and type-B contributions to the uncertainty budget of the PTB measurements. The choice of a single-turn auxiliary winding included into the primary circuit is common to all three configurations. resistance ratio RH(2) / 100 10 k / 100 100 / 1 Relative standard uncertainties / 10-9 / 10-9 / 10-9 Reference CCC bridge Imperfect CCC winding ratio Resistive divider calibration Leakage resistances - Noise rectification in CCC Imperfect realization of the QHR - - Correction for 1 Hz-dc difference Combined type-B std. uncertainty uB = Final Report Page 5 Note that in Table 3 the type-B uncertainty of the bridge voltage includes the finite non-linearity of the voltage detector and the possible bias added to U as a consequence of noise rectification in the SQUID sensor with its non-linear voltage-flux dependence. The systematic effect of the duration of the current reversal cycle on U is treated separately.
9 This is done in terms of a low-frequency feature of the resistors to be compared, in analogy with the 1 Hz dc difference (see section 7). If not stated otherwise, the measurements are performed with cycles as follows: positive current plateau , current reversal, negative current plateau , current reversal. During each plateau time (nominally s, but effectively longer by about 15% needed for data exchange with the PC), 500 bridge voltage data points are read at a rate of 50 samples per second, but only the second half of these data enters the calculation of U as described in [13]. The ramping time of the current reversals is as short as s in all of the measurements with the PTB setup in this comparison. For the sake of simplicity, the quantity we call cycle time TC later in this report is just two times the nominal plateau duration, , 20 s for the standard case. Additional notes on uncertainty contributions: (a) The numbers given in this line of the table are based on the estimation of an upper limit for the relative winding ratio error of 1 10-10; the corresponding uncertainty is treated as one with a rectangular distribution.
10 The purely geometry-related ratio error cannot be easily discriminated from mixing-down effects in measurements via the SQUID (the latter already enter the type-B uncertainty of U as mentioned above.) A ratio error test is performed with a current I flowing through 2 CCC windings (or series combinations of several winding) with the same total numbers of turns, N, in opposition. Both effects will contribute to the measured residual signal, but the true geometry-related error will dominate in the limit of high NI products. As a consequence, one typically has less reliable ratio error data for windings with low numbers of turns. An earlier comprehensive set of ratio error tests revealed the following results: For 8 configurations with N 512 and the product NI between 20 and 80 A (peak-peak), we found the relative ratio error to be smaller than 4 10-12. For 32 configurations with N from 4 to 256 and NI between 2 to 10 A, we found a maximum relative ratio error of less than 4 10-11.