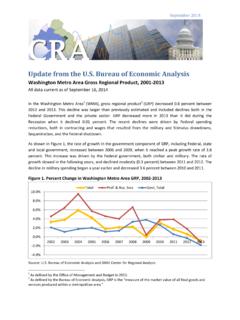
Transcription of Bureau of Economic Analysis - Oklahoma State University ...
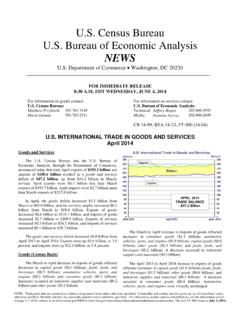
1 Bureau of Economic Analysis Local Area Data- Provides an immense amount of data on income and employment Data available from the national level to the county Typically lagged about 2 years State and Local Data Available via These Links National Data Available via This Link To find county-level data, click on Local Area Personal Income and Employment 1969-2009 Click the + to reveal available data by each geography; since we are focusing on county data, click the + beside County Personal Income and Employment Click the table name (in blue) that contains the data for which you are looking Choose Oklahoma in the State box, then click Next Step Choose the county of interest, the years for which you want data (1969-2009), and any/all of the data in the table. The ever important footnote!! OPTIONS: Allows you to change the county, year and/or statistic reported CHART: Construct a chart using the data DOWNLOAD: Download your data as an Excel, CSV or PDF file PRINT: Print the data ADD THIS: Share the data via FB, Twitter, blog, email, etc.
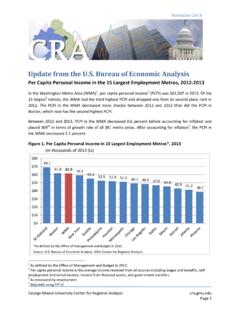
2 Your data! Bearfacts provides a quick summary of data in your county Same OPTIONS and TOOLS as before Registering will allow you to save your query You can also get a link directly to your query results ( , to cite in a publication) by clicking the chain Your Turn Compare the per capita income and average wage per job of Texas County and the State of Oklahoma for 2009 Local Area Unemployment Statistics (LAUS) US Bureau of Labor Statistics, Provides 4 important data points monthly Labor Force Employment Unemployment Unemployment Rate Data is from monthly, household survey Place of residence basis No industry details Click here to access data 1. Choose your State 2. Choose your geography 3. Choose any (or all!) of the specific locations listed 4. Option not always available; if it is, choose seasonally adjusted 5. Click here to Get Data Change years which appear; click GO to change data Output generated contains monthly data for each of the data items; default presents them by county Clicking here will download Adair County data ONLY!
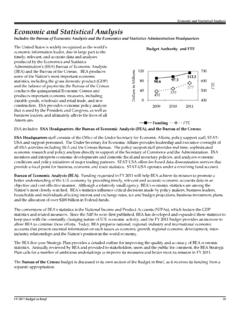
3 You can change format options, however! Changes how data is arranged: Table (default); Column (rather than all 4 variables in one table, creates a table for each variable); multi-series table (one table for all observations) Change data that is provided Various time options Check here to generate graphs for each location of the data checked above Click here to apply settings Clicking here now will download the 12-month percentage change for all 4 variables for ALL counties, 1990-2011 Click here for a map to compare all counties Select geography of interest Select State , data to be drawn and month/year for data To draw/update map, click here What you get is the map (above) and a table with the raw and calculated data (right)! Your Turn Find your county s unemployment rate in December, 2007 What was the 12-month percent change in unemployment between December 2007 and December 2008 for your county? Employment and establishment data Available for counties, MSAs and states, 1992-2008, by industry Uniquely categorizes data into the following categories: Noncommercial (educational institutions, post offices, government agencies and nonprofits) Nonresident (operating presence in OK, but headquartered elsewhere) Resident (operating and headquartered in OK; by stage or employment classes) Self-employed Stage 1 (1-9 employees) Stage 2 (10-99 employees) Stage 3 (100-499 employees) Stage 4 (500 + employees) Can view establishment and employment data 4 ways: Composition: % of total in a given year Growth: actual change and % change between two years Industry ( State and national data only) Rankings ( State and national data only) Select data you want to view Change industry by selecting the industry in the drop down box Select the MSA or county you want.
4 Default values given are for the State Select years for comparison Your Turn Determine which stage of business in the manufacturing sector added the most jobs between 2005 and 2007 in Texas County. By how much did this stage grow over this period? To the extent that jobs were created in the manufacturing sector, what growth factors explain these net new jobs: New businesses? Expanded businesses? Relocated businesses? Change in NAICS category?