Transcription of CABLE HISTORICAL OPERATING TEMPERATURE …
1 CABLE HISTORICAL OPERATING TEMPERATURE estimator . presented to: North American Transmission & distribution Conference & Expo June 13-15, 2006, Montreal, Canada Francisco de Le n*, Patrick St-Roch, and Christian Beauregard CYME International T&D Inc. 1485 Roberval, Suite 104. St-Bruno (Quebec) - J3V 3P8, Canada Tel. (450) 461 3655 - Fax. (450) 461 0966. * Presenter Keywords: Ampacity; CABLE Aging; CABLE normal OPERATING TEMPERATURE ; CABLE emergency TEMPERATURE I. Introduction There are many underground (UG) transmission/ distribution systems in operation for longer than 50 years (a few even longer than 100 years). Utilities are facing the need to provide reliable service with an aging CABLE infrastructure. UG system planners and operators currently do not know if (which, where, when and for how long) cables have exceeded, at some point in time, their OPERATING or emergency TEMPERATURE .
2 There exists a gamut of testing techniques aimed to estimate the age, or more precisely, the remaining life of cables [1-15]. Standardized procedures are listed in references [1-2]. One must distinguish between thermal aging , mechanical aging and electrical aging . The CABLE HISTORICAL OPERATING TEMPERATURE estimator (CHOTE). described in this paper presents a contribution to help determine the thermal age of cables. CHOTE is a software application offering an innovative way to evaluate the TEMPERATURE at which underground CABLE systems have operated during their in-service life. CHOTE is capable of providing answers to the following questions: Which cables have exceeded their normal OPERATING TEMPERATURE and for how long? Which cables have exceeded their emergency TEMPERATURE and for how long?
3 Given a predicted load growth: when in the future cables will reach their maximum design TEMPERATURE ? Answers to those questions shall help CABLE engineers to plan CABLE additions and substitutions in and informed manner. As a consequence capital investments in CABLE infrastructure can be managed efficiently. 1. 2. Transient CABLE Rating CABLE OPERATING TEMPERATURE very much depends on the load shape applied to the CABLE . I other words, the TEMPERATURE of a CABLE depends on the intensity of the current and its time variations. Therefore, cables have different ratings, steady state, cyclic, emergency and short circuit. Since cables installations have thermal inertia, it takes time to heat up the CABLE and its surroundings. Transient analyses are typically used to compute CABLE thermal ratings under emergency situations.
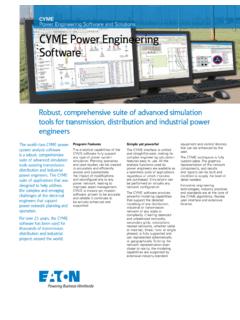
4 However, the same computations can be used in a continuous way to compute the OPERATING TEMPERATURE of cables in an installation. CHOTE used the transient engine of CYMCAP (CYME International T&D, CABLE Ampacity Program) [16]. processing HISTORICAL archived information of CABLE load shapes. The inputs for a CABLE thermal transient simulation are: The geometrical distribution and thermal parameters Detailed CABLE construction (including materials). Bonding arrangement Load shapes for all cables in the installation The necessary geometrical/thermal parameters depend on the type of installation. For a typical underground installation in North America (cables in duct banks) one would need: duct bank width, height and burial depth; thermal resistivities of the native soil and duct bank; and the soil TEMPERATURE at burial depth.
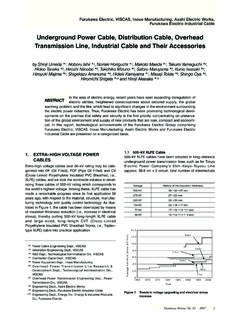
5 Figure 1 graphically shows a typical installation. Figure 1. A typical duct bank installation 2. The necessary data for a CABLE includes: CABLE construction: one core or three core; CABLE type: extruded, concentric neutral, etc.; the phase-to-phase voltage of the system where the CABLE will be used; the conductor material and caliber or area; the conductor diameter; the thickness or diameter of every layer of the CABLE ; for example, conductor shield, insulation, insulation screen, sheath, sheath reinforcement, concentric wires, armour bedding, armour, serving, and jacket. Additionally, for some of the layers more information may be needed. For concentric wires even the length of lay and the number of wires is convenient to know. Figure 2 shows the construction details of the two cables used in the sample installation of Figure 1.
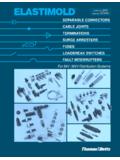
6 Figure 2. Details of CABLE construction (transmission and distribution ). Loads for transient calculations are typically represented on hourly resolution on duration of 24 to 168 hours. A typical weekly load shape is shown in Figure 3. Figure 3. Typical weekly load shape in per unit With the above information transient calculations can be made using the methods described in the standards IEC 287 [17-23] and IEC 853 [24-25]. The underlying principle is to solve an analog thermal-electrical equivalent circuit. Figure 4. depicts a representative circuit. The interested reader can find all the details in the excellent book by Anders, reference [26]. 3. Figure 4. Analog thermal-electrical circuit for the calculation of transients A typical response to step variation is shown in Figure 5. One can appreciate that the TEMPERATURE of the CABLE follows in an exponential way the changes in current.
7 Current TEMPERATURE Figure 5. Typical transient response to a step change 3. Description of CHOTE. Using transient simulations, CHOTE processes archived loading information usually available through the SCADA/PI systems on an hourly (or 15 minutes) resolution. Thus, the input to the TEMPERATURE estimator is the current of all cables on a particular installation. CHOTE is capable of automatically analyzing all the thermal sections of a system. This may include transmission and even the entire distribution system (manhole-to-manhole). The TEMPERATURE estimator can process achieved information for any length of time. Currently 10 years of HISTORICAL data are being used. Figure 6. shows the user interface screen of the application. 4. Figure 5. CHOTE user interface screen The output of CHOTE is a list of CABLE sections that have exceeded the (definable) normal and/or emergency target temperatures .
8 CHOTE produces a global ranking report. The cables that exceed their target (normal/emergency) temperatures for the longest time are given the first place in the report. The output displays not only where, but also when the hot spots have occurred. Figure 6 shows a typical output screen. Figure 6. Output screen of CHOTE showing the list of cables that exceed the specified normal OPERATING TEMPERATURE (90 C). 5. CHOTE is capable of indicating the location of the cables that have exceeded a target, either normal or emergency, TEMPERATURE . It will give the thermal section (manhole-to-manhole), the feeder name, the dates, times and for how long certain TEMPERATURE was exceeded (Figure 6). Additionally, the application shows graphically the location of the CABLE with problems in the duct bank and even allows re-creating the condition that produced the TEMPERATURE problem (see Figure 7).
9 Figure 7. The left-hand side shows the location of the CABLE exceeding the target TEMPERATURE of 90 C. On the right-hand side is the re-creation of the CABLE TEMPERATURE curve. Note how it exceeds the 90 C target CHOTE can perform what-if scenarios to study the impact of addition of new cables. This facility can also be used to determine the remaining ampacity of one or more of the cables installed in a given duct bank. 4. Technical/Economical Benefits of CHOTE. CHOTE provides important information to transmission and distribution engineers. CHOTE allows identifying, qualifying and quantifying the following important conditions: The cables and CABLE installations that have been exposed to thermal damage. Say which cables have exceeded their normal and/or emergency temperatures during their in-service life.
10 For how long and for how much the applied over- temperatures compare with the original design characteristics. CABLE engineers can take advantage of the above information to plan additions and/or substitutions in and informed manner. By using CHOTE an engineer knows for how long each CABLE has exceeded a desired certain target TEMPERATURE . As a consequence, there is valuable information to estimate the remaining life of a CABLE , which can be used to manage efficiently capital investments in CABLE installations. For example, an investment to substitute a CABLE can be postponed, or planned to do it just in time , with greater certainty thanks to the information that CHOTE offers. 6. 5. Future Developments of CHOTE. To enhance the analytical power of the CABLE TEMPERATURE estimator a load growth analysis facility would be added to allow engineers to determine when in the future a CABLE will reach its normal and/or emergency temperatures .