Transcription of Calculation of Risk Factor - cetorp.dk
1 Carl Erik Torp (Elec. Eng.) Ejbydalsvej 239 DK-2600 Glostrup Denmark Calculation of Risk Factor Using the Excel spreadsheet Calculation of Risk Table of Contents Events, Impact and Software Validation Many software products in complex computer systems like LIS or LIMS involve a potential risk that some adverse events may have an impact on the companies using the software. Events may be caused by software errors or by actions causing the software to behave unexpectedly and in a faulty manner. A way to prevent impact is to identify the most risky error events in the computer system and then perform a risk-based validation of the associated software in order to avoid or reduce the effect of fault conditions. The Risk Factor Calculation spreadsheet is a tool that may help to estimate the severity of such risks and to prioritize of the software validation efforts with respect to scope and depth. The calculated risk factors can only be used in this context and are not meant as a general measure for risks caused by software malfunction and errors.
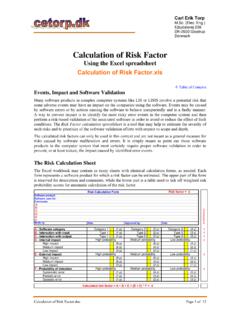
2 It is simply meant to point out those software products in the computer system that most certainly require proper software validation in order to prevent, or at least reduce, the impact caused by identified error events. The Risk Calculation Sheet The Excel workbook may contain as many sheets with identical Calculation forms, as needed. Each form represents a software product for which a risk Factor can be estimated. The upper part of the form is reserved for description and comments, while the lower part is a table used to tick off weighted risk probability scores for automatic Calculation of the risk Factor . Risk Calculation Form0 Made by: A Category 1 (1 p)Category 2 (2 p)Category 3 - Software category(4 p)0B - Interaction with inputType 1 (1 p)Type 2 (2 p)Type 3 (3 p)0C - Interaction with outputType 1 (1 p)Type 2 (2 p)Type 3 (3 p)0D -0 Internal impactHigh impact(9 p)(6 p)(4 p)Medium impact(6 p)(4 p)(2 p)Low impact(3 p)(2 p)(1 p)E - External impactHigh impact(9 p)(6 p)(4 p)Medium impact(6 p)(4 p)(2 p)Low impact0(3 p)(2 p)(1 p)F - Probability of detectionSystematic error(1 p)(4 p)(5 p)Periodic error(1 p)(3 p)(4 p)Sporadic error0(1 p)(2 p)(3 p)0 Risk Factor = Calculated risk Factor = A + B + C + (D + E) * F = A: B: C: D: E: F: ConsequenceLow probabilityDate: Approved by: Date: Software product: Software used for: High probabilityMedium probabilityLow probabilityComments.
3 Medium probabilityHigh probabilityLow probabilityHigh probabilityMedium probability Calculation of Risk Page 1 of 12 Carl Erik Torp (Elec. Eng.) Ejbydalsvej 239 DK-2600 Glostrup Denmark The calculated risk Factor (which is a number between 0 and 100) is a relative quantity that only has meaning when compared to other factors estimated on the same basis. The actual risks should always be estimated using the system perspective ( estimated relative to the actual system, not a particular process in the system) since that will provide the best basis for comparison. All sheets use the same score, and each score value is obtained by reference to a similar value stored in a hidden sheet named Basis . Thus, if a basic score value is changed the Calculation on all sheets will change accordingly. All sheets are write-protected (without password) so that only the description area and the yellow tick off cells can be altered. The Template sheet is intended as a template for the Copy and function which must be used to create additional identical Risk Calculation sheets.
4 Description and comments Software product: Unique name of the software product or module being risk assessed. Software used for: Brief description of what the software product or module is used for. Comments: General notes - Estimated error event: Error occurs when .. A: Software category - Customized standard software .. B: Interaction with input - Input from operator and another module .. C: Interaction with output - Output to operator and database .. D: Internal impact - Low probability and medium impact because .. E: External impact - High probability and medium impact because .. F: Probability of detection - The systematic error is detected immediately due to .. Made by: Date: Approved by: Date: A: Software Category The software category is divided into three levels as defined in the table below. Most software modules in a LIMS system belong to Category 2 while software products, which are customized or developed by the users themselves (such as spreadsheets) belong to Category 3.
5 Operative systems and MS Office packages are normally Category 1. Category Description Category 1 * Standard Software Packages Commercial off-the-shelf (OTS) software packages. Examples: Excel spreadsheets and PC-controlled instruments with minimum configuration. Category 2 Custom Configurable Software Packages Typical features of these systems are that they permit users to develop their own applications by configuring predefined software modules and by develop-ing new application software modules. Examples: Human Machine Interfaces (HMI), Supervisory Control and Data Acquisition (SCADA), Laboratory Automation Systems (LAS), Material Requirements Planning Systems (MRP) and Laboratory Information Manufacturing Systems (LIMS). Category 3 * Custom Built Software Includes any application, off-the-shelf software or other software products that are modified or developed according to custom requirements. This also applies to Standard Software Packages used to develop custom applications and to programming languages.
6 * Complex spreadsheets with macros belong to Category 3. Calculation of Risk Page 2 of 12 Carl Erik Torp (Elec. Eng.) Ejbydalsvej 239 DK-2600 Glostrup Denmark B & C: Interaction with Input & Output Interaction in this context indicates that there is a risk whenever data are transferred to (output) or from (input) other software. data may be received incorrectly or may be corrupted, or the receiver may respond inappropriately or unexpectedly. It should also be taken into account if data can be re-transmitted in case of errors and that the operator may be part of the risk, even if the data transfer is entirely controlled by software. It is important to make a distinction between input and output. To make the estimate easier, the risks are divided into three types based on the amount and importance of the transferred data. Interaction with Input & output Type 1 Very few data and/or insignificant contents Low risk Type 2 Certain amount of data and/or rather important contents Medium risk Type 3 Large amount of data and/or very critical contents High risk D & E: Internal & External Impact Impact is a measure of how severe and harmful a possible software error event is for the company.
7 This indefinable quantity cannot stand alone, but has to be combined with the probability of the event to occur. An event may be an unexpected behaviour caused by a software error, but may also be an operator action that makes the software behave in an unexpected or faulty manner. The probability of a severe error event is normally specified by its frequency which may be defined as once per number of transactions or as once per time interval. Probability (frequency) of error event High Occurs quite often once per 100 transactions or once per day Medium Occurs frequently once per transactions or once per month Low Occurs seldom once per transactions or once per year An impact may have both internal and external Internal - impact on production, profitability, employee satisfaction etc. External - impact on regulations, reputation, customer satisfaction etc. And the risk may thus be estimated as Internal impact with High effect - severe impact if the production is stopped in several days Medium effect - modest impact if just a single report has to be recalled Low effect - minimal impact if only a few analyses have to be repeated External impact with High effect - severe impact if requirements from authorities cannot be met Medium effect - modest impact if the authority s action is limited to issue a warning Low effect - minimal impact if only a single customer becomes discontented In addition, it should be considered if there is a time-dependent aspect associated with the impact, if there is a significant long-term effect to take into account after if the damage has been repaired.
8 Calculation of Risk Page 3 of 12 Carl Erik Torp (Elec. Eng.) Ejbydalsvej 239 DK-2600 Glostrup Denmark As a main rule, the probability and the effect of impact should always be estimated in the system perspective ( estimated relative to the entire system), even if the software is part of a larger process or data-flow. The probability of impact is generally the same for the internal and external estimate, but in some cases there may be a difference because the effect is estimated in the system perspective. A certain error could be regarded externally as damaging to the business, but internally as a harmless incident. F: Probability of Detection The consequence of an event may depend on the probability of detecting the occurrence. a minor failure that is difficult to detect may cause far more damage than a severe error which is detected im-mediately. Probability of detection High Highly likely each time the event occurs Medium Reasonably likely each time or every two times Low Almost unlikely less than every two times It is common practice to assume that the probabilities of systematic software errors are high but it is not evident that systematic errors should be detected immediately.
9 Less regular occurrences of soft-ware errors are denoted periodic and sporadic. Such errors can be more difficult to detect, but may cause less damage since they occur less frequently. In order to take this aspect into consideration, the risk score for the probability of detection is weighted by the frequency of occurrence - a high score if systematic, a medium score if periodic, and a low score if sporadic occurrence. Probability of detection weighted by Frequency of occurrence Systematic Each time (High) E. g. a program error or data transfer failure Periodic Periodically (Medium)E. g. may depend on certain users or time of operation Sporadic Once in a while (Low)E. g. random error - could be a hardware problem The weighting may not be linear and the cells in the form are therefore assigned individual values. Calculation of the Risk Factor The formula for Calculation of the risk Factor is 0 Calculated risk Factor = A + B + C + (D + E) * F 100 If the original basic score values are used in the Calculation , the result will be a number between 0 and 100.
10 The medium value (all estimates set to medium) is 30 and the lowest reasonable value is 5. The values in the right-most columns are the risk contributions for each of the impact categories A - F and are termed consequence since they indicate the significance of the individual risk categories. If the consequences for different events are compared with each other, a risk pattern could be revealed and hereby give hints to risk mitigation strategies. if a computer system is estimated to have many relatively small risks with dominant external impact consequences, it might be at good idea to focus on the cause of this condition and find out if special software validation is required. Calculation of Risk Page 4 of 12 Carl Erik Torp (Elec. Eng.) Ejbydalsvej 239 DK-2600 Glostrup Denmark Risk Factor in short Formal: 0 Risk Factor 100 (when using original basic score values) Risk Factor highest value = 100 Risk Factor medium value = 30 Risk Factor lowest value = 5 Risk factors are relative to the system perspective Risk factors must be used with care Risk factors are used for.