Transcription of CalPERS Investment Cost Effectiveness Analysis - Summary ...
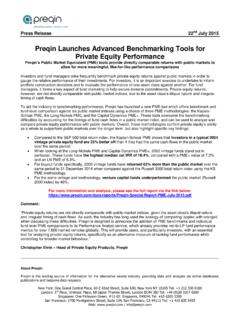
1 Item 7c, Attachment 1, Page 1 of 15. CalPERS . Investment cost Effectiveness Analysis - Summary of Results For the 5 year period ending December 31, 2014. Item 7c, Attachment 1, Page 2 of 15. This benchmarking report compares CalPERS cost and return performance to CEM's extensive pension database. 155 pension funds participate. The median fund had assets of $ billion and the average Participating assets ($ trillions). fund had assets of $ billion. Total participating assets were $ trillion. Asia-Pacific Europe 79 Canadian funds participate with assets totaling Canada $1,048 billion. United States 60 European funds participate with aggregate assets of $ trillion. Included are funds from the Netherlands, Norway, Sweden, Finland, Ireland, Denmark and the 7 Asia-Pacific funds participate with aggregate assets of $711 billion. Included are funds from Australia, New Zealand, China and South Korea.
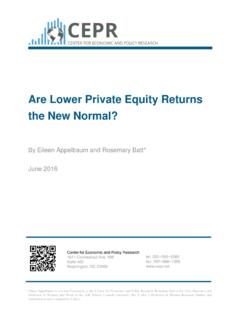
2 2 Gulf region funds participate. The most meaningful comparisons for CalPERS . returns and value added are to the universe. 92 94 96 98 00 02 04 06 08 10 12 14. 2015 CEM Benchmarking Inc. Executive Summary | 2. Item 7c, Attachment 1, Page 3 of 15. The most valuable comparisons for cost performance are to CalPERS custom peer group because size impacts costs. Peer group for CalPERS . 14 global sponsors from $117 billion to $844 billion Median size of $184 billion versus CalPERS $295 billion 6 Sponsors, 3 Canadian, 3 European, 2 Asia-Pacific 900,000. Peer 800,000 CalPERS . 700,000. 600,000. $ millions 500,000. 400,000. 300,000. 200,000. 100,000. 0. To preserve client confidentiality, given potential access to documents as permitted by the Freedom of Information Act, we do not disclose your peers'. names in this document. 2015 CEM Benchmarking Inc.
3 Executive Summary | 3. Item 7c, Attachment 1, Page 4 of 15. CalPERS Investment costs were $1, million or basis points in 2014. Asset management costs by Internal Management External Management Footnotes asset class and style ($000s) Passive Active Overseeing Passive Active Perform. Default underlying costs were added to fund of funds. of external fees base fees fees Total The defaults added were: Public Market Equities 1,724 23,944 3,825 73,355 77,042 179,891 Hedge Funds 150 bps base Fixed Income 33 27,618 318 7,312 4,199 39,480 fees 144 bp performance Global TAA 1,835 6,147 8,775 16,757 fees;. Hedge Funds - Direct 6,408 53,916 66,190 126,514 Refer to Appendix A for full Hedge Funds - Fund of Funds 948 19,206 13,384 33,537 details. Total cost excludes Commodities 205 205. carry/ performance fees for Real Estate - LPs 26,420 189,559 621,349 215,979 real estate, infrastructure, Infrastructure 1,228 1,228 natural resources and private Infrastructure - LPs 3,058 9,572 38,796 12,630 equity .
4 performance fees are Natural Resources - LPs 666 7,165 7,831 included for the public market Diversified private equity 2,252 14,430 773 427,321 444,776 asset classes and hedge funds. Excludes non- Investment Diversified - Fund of Funds 3,963 81,724 85,687. costs, such as PBGC premiums Overlay Programs 125 0 125 and preparing checks for Total asset management costs excluding private asset performance fees 1,164,640 retirees. Oversight, custodial and other costs . Oversight & consulting 13,406. Trustee & custodial 4,722. Audit 1,197. Other 4,895. Total oversight, custodial & other costs 24,220 Total Investment cost (excluding transaction and private asset performance fees) 1,188,859 2015 CEM Benchmarking Inc. Executive Summary | 4. Item 7c, Attachment 1, Page 5 of 15. The following cost types are included in the calculation of your total Investment cost .
5 Internal External In-house total Transaction Manager base Monitoring & Perform. fees Transaction Asset class cost costs fees other costs (active only) costs Public (Stock, Fixed income, commodities, . REITs). Derivatives/Overlays . Hedge funds & Global TAA. Hedge Funds -- -- . Global TAA . private equity (Diversified private equity , venture * . capital, LBO, other private equity ). private real assets (Infrastructure, natural resources, real estate ex-REITs, other real . assets). *External manager base fees represent gross contractual management fees. "--" indicates that the cost type is not applicable. Green shading indicates that the cost type has been newly added for the 2014 data year. CEM currently excludes external private asset performance fees and all transaction costs from your total cost because only a limited number of participants are currently able to provide complete data.
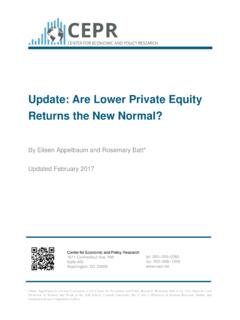
6 2015 CEM Benchmarking Inc. Executive Summary | 5. Item 7c, Attachment 1, Page 6 of 15. CalPERS costs decreased between 2010 and 2014. Starting in 2014, CEM began including hedge fund Trend in your Investment costs performance fees in total costs. Prior year costs do not include hedge fund performance fees. This is the reason for the slight up-tick in costs in 2014. 60bp CalPERS costs decreased primarily because: 50bp CalPERS decreased its Investment in the highest cost asset classes. Its holdings of 40bp cost in basis points hedge funds, real estate and private equity decreased from 24% of assets in 2010 to 21%. in 2014. 30bp CalPERS increased its use of lower cost passive 20bp and internal management from 64% of assets in 2010 to 69% in 2014. 10bp 0bp 2010 2011 2012 2013 2014. Public Assets (ex. Hedge funds). private Assets &.
7 Hedge Funds Oversight Total cost 2015 CEM Benchmarking Inc. Executive Summary | 6. Item 7c, Attachment 1, Page 7 of 15. CalPERS total Investment cost of bps was slightly below the peer median of bps. Differences in total Investment cost are often caused Total Investment cost by two factors that are often outside of excluding transaction costs and management's control: private asset performance fees Asset mix, particularly holdings of the highest cost 120 bp asset classes: real estate (excl REITS), infrastructure, hedge funds and private equity . These high cost assets equaled 21% of CalPERS 100 bp assets at the end of 2014 versus a peer average of 21%. Fund size. Bigger funds have advantages of scale. 80 bp Therefore, to assess whether CalPERS costs are high or low given your unique asset mix and size, CEM 60 bp calculates a benchmark cost for CalPERS fund.
8 This Analysis is shown on the following page. 40 bp Legend 90th 20 bp 75th median 25th 10th 0 bp your value Peer Universe peer avg 2015 CEM Benchmarking Inc. Executive Summary | 7. Item 7c, Attachment 1, Page 8 of 15. Benchmark cost Analysis suggests that, after adjusting for fund size and asset mix, CalPERS fund was slightly low cost by basis points in 2014. CalPERS benchmark cost is an estimate of what CalPERS Your cost versus benchmark cost would be given its actual asset mix and the median costs that its peers pay for similar services. It represents $000s basis points the cost CalPERS peers would incur if they had its actual CalPERS total Investment cost 1,188,859 bp asset mix. CalPERS benchmark cost 1,240,360 bp CalPERS excess cost (51,501) ( ) bp CalPERS total cost of bp was slightly below its benchmark cost of bp. Thus, its cost savings was bp.
9 2015 CEM Benchmarking Inc. Executive Summary | 8. Item 7c, Attachment 1, Page 9 of 15. CalPERS was slightly low cost because it had a lower cost implementation style and paid less than peers for similar services Reasons for CalPERS low cost status Excess cost /. (Savings). $000s bps 1. Lower cost implementation style Less fund of funds (23,389) ( ). Use of external active management 42,700 (vs. lower cost passive and internal). Less overlays (42,373) ( ). Other style differences (9,726) ( ). (32,788) ( ). 2. Paying less than peers for similar services External Investment management costs (4,452) ( ). Internal Investment management costs 11,509 Oversight, custodial & other costs (25,769) ( ). (18,712) ( ). Total savings (51,501) ( ). 2015 CEM Benchmarking Inc. Executive Summary | 9. Item 7c, Attachment 1, Page 10 of 15. Differences in cost performance are often caused by differences in implementation style.
10 Implementation style is defined as the way in Implementation style . which your fund implements asset allocation. It includes internal, external, active, passive and 100%. fund of funds styles. 90%. 80%. The greatest cost impact is usually caused by differences in the use of: 70%. 60%. External active management because it tends 50%. to be much more expensive than internal or passive management. CalPERS used less 40%. external active management than its peers (its 30%. 31% versus 34% for its peers). 20%. Within external active holdings, fund of funds 10%. usage because it is more expensive than direct 0%. fund Investment . CalPERS had less in fund of CalPERS Peers Funds funds. CalPERS 9% of hedge funds, real estate Internal passive 36% 23% 4%. and private equity in fund of funds compared Internal active 32% 36% 6%. to 15% for your peers.