Transcription of Can the Kiwi Fly? Achieving Productivity Lift-o in New Zealand
1 Can the Kiwi Fly? AchievingProductivity Lift-off in NewZealandPaul Conway1 New Zealand Productivity CommissionABSTRACTNew Zealand s poor long-run Productivity performance has puzzled domesticeconomists and international observers for decades. To provide answers, thisarticle sketches out the broad reasons why lifting Productivity has proven sodifficult. Against the background of ongoing changes in technology and in theglobal trading environment, the article also puts forward a number of high-levelpolicy suggestions aimed at countering the economic forces that have constrainedproductivity, including opening the economy to new opportunities for interna-tional connection, and encouraging capital deepening, greater competition andmore effective innovation.
2 Getting this right requires a deep understanding ofNew Zealand s Productivity track record and potential in the 21st century globaleconomy and presents a major challenge for the New Zealand public living standards in New Zealandwere once among the highest in the 1950, GDP per capita in New Zealandwas around 125 per cent of the OECD average (Conway and Orr, 2000). At thistime, colonial ties to the United Kingdomprovided easy access to capital, expertise,and a secure market for New Zealand sagricultural exports at guaranteed facilitated specialization and scale inan area of strong comparative economy was highly concentrated inthe production and processing of primaryproducts and much of the policy andinstitutional focus was on distributingwealth generated from these activities acrossthe the 1960s.
3 New Zealand s relativestandard of living began to slip as exportrevenues became insufficient for a growingpopulation and volatile commodity marketshighlighted the vulnerabilities of a narroweconomic s entry intoEurope in 1972 and widespread increasesin protectionism for agricultural productsrestricted the ability of primary producersto reap the benefits of their response, the government1 The author is Director of Economics and Research at the New Zealand Productivity Commission. Hewould like to thank colleagues at the New Zealand Productivity Commission, at the OECD and twoanonymous referees for helpful comments and suggestions.
4 He is particularly grateful to Dr GrahamScott, Commissioner at the New Zealand Productivity Commission and past Secretary of the New ZealandTreasury, for his many insights and suggestions. The opinions, findings, recommendations, and conclusionsexpressed are those of the author, not the Productivity Commission or Statistics New Zealand . 2018of the day implemented an increasinglyprotectionist and dirigist micro agendaalong with expansionary fiscal and contributed to a generalworsening in New Zealand s economicsituation and by 1980 GDP per capita hadfallen to around 90 per cent of the ,widespreaddissatisfactionwiththesystema ticunderperformance of the New Zealandeconomypromptedaperiodofcomprehen sive economic reform aimed atimproving both microeconomic efficiencyand macroeconomic stability.
5 These reformstransformed the economy from one of themost interventionist in the OECD to oneof the most open and market-based. Overthe latter part of the 1980s and into theearly 1990s, the rigours of microeconomicadjustment coincided with a deep globalrecession and a shock market collapse. In1992, GDP per capita fell to a low of around80 per cent of the OECD the post-reform period, New Zealand seconomic performance has improved andGDP per capita is currently around 90 percent of the OECD average.
6 Since the mid-1990s, growth in hours worked per capita hasbeen strong while multi-factor Productivity (MFP) increased markedly over the , this surge in MFP faded by2000, consistent with the idea that economicreform delivered a level shift in productivitybut did not significantly increase its long-rungrowth strong growth over the1990s, and despite a low level of productivityvis-`a-vis high-income OECD economies,NewZealand slong-runproductivityperformance has been poor by is unusual within theOECD, given that lagging economieshave,in principle.
7 Greater scope forimproving Productivity more quickly thanleading Zealand s lackof Productivity catch-up is even moreperplexing given that its economic policiesare often regarded as fit for shed some light, this article outlinesrecent evidence on the underlying reasonsfor New Zealand s comparatively poor long-run Productivity performance. This reviewis undertaken against the background ofa growing literature on potential reasonsfor sustained Productivity differences acrossfirms and economies, despite the expectationthat technology diffusion and marketselection effects should tend to equalizeproductivity over the outset, it is important toacknowledge that New Zealand with lowpopulation scale and density and extremegeographic isolation is not a typical.
8 New Zealand sdevelopment path may be different from thatof larger or better-connected economies. Forexample, New Zealand s unique economicgeography might imply a development pathbased around tasks and activities that tendnot to agglomerate in large global sdistinctmixofcharacteristics also adds to the challengeof understanding the economy and ,important aspects of NewZealand s Productivity story are yet tobe researched in detail and parts of thediagnosis and policy prescription outlined inthis article are exploratory.
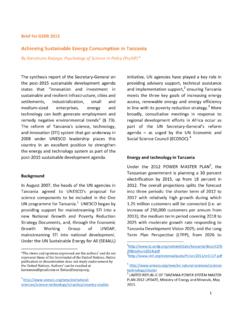
9 By highlightingareas of uncertainty, the article also servesas the basis of an ongoing research agendaaimed at lifting New Zealand s article proceeds as follows. Section1 outlines New Zealand s productivityperformance at the aggregate and firm 2 discusses the underlying reasonsfor slow Productivity growth in the marketsector of the New Zealand economy. Section3 focuses on the role of policy in respondingINTERNATIONALPRODUCTIVITYMONIT OR41 Chart 1: Contributions to Labour Productivity Growth in New Zealand , 1997-2017 Source.
10 Statistics New Zealandto New Zealand s Productivity remarks are offered in Section sProductivityPerformanceAggregate Drivers of GrowthProductivity growth in New Zealand hasbeen reasonable in some years and in someindustries but has generally been weak ininternational comparison over the long with this relatively poor long-runproductivity growth performance, the levelof labour Productivity in New Zealand hasbeen well below the average of high-incomeOECD economies for some the mid-2000s, New Zealand has notsuffered the same decline in MFP growthseen in many OECD economies apart froma strong negative outturn in 2009, MFPgrowth strengthened a little post the GlobalFinancial Crisis (GFC) (Chart 1).