Transcription of Canadian Federal and Provincial Fiscal Tables
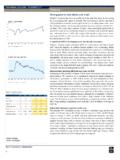
1 Canadian Federal and Provincial Fiscal Tables Budget balances Budget balances relative to GDP. Revenues, annual growth rate Revenues relative to GDP. Total expenses, annual growth rate Total expenses, relative to GDP. Program expenses, annual growth rate Program expenses relative to GDP. Program expenses per capita Net debt Net debt to GDP ratio Net debt per capita April 16, 2019. Note: the Tables are based on the public accounts of Provincial and Federal governments. Due to differences in accounting and reporting practices, figures are not strictly comparable between provinces. Moreover, a province's accounting and reporting practices may have changed over time, limiting the exten- tent to which historical comparisons can be made. FOCUS ON CANADA'S HOUSEHOLD DEBT | MARCH 26, 2018. Provincial budget balances1 Million $.. ALT A 2 SASK MAN ONT QUE 5 P . Fe d e ral La st up d a te d 19-Feb-19 27-Feb-19 20-Mar-19 07-Mar-19 11-Apr-19 21-Mar-19 19-Mar-19 26-Mar-19 23-Nov-18 16-Apr-19 19-Mar-19.
2 1981-82 -141 2,133 140 -251 -1,780 -2,621 -160 -382 1 -148 -15,674. 1982-83 -1,241 -796 -227 -435 -3,189 -2,463 -392 -371 -25 -191 -29,049. 1983-84 -963 129 -332 -429 -3,153 -2,163 -276 -316 4 -326 -32,363. 1984-85 -822 1,245 -380 -483 -2,559 -3,873 -279 -368 -4 -252 -37,167. 1985-86 -857 -761 -579 -528 -2,614 -3,473 -213 -353 -20 -253 -33,389. 1986-87 -635 -4,033 -1,232 -559 -2,634 -2,972 -368 -277 -13 -231 -29,842. A c tual ( no adjus tments made w ith r es pec t to ac c o unting o r o ther c hanges ). 1987-88 71 -1,365 -542 -300 -2,489 -2,396 -335 -227 -17 -197 -29,017. 1988-89 930 -2,007 -324 -141 -1,479 -1,704 -79 -242 -11 -226 -27,947. 1989-90 496 -2,116 -378 -142 90 -1,764 -24 -267 -8 -175 -29,143. 1990-91 -667 -1,832 -361 -292 -3,029 -2,975 -182 -257 -20 -347 -33,899. 1991-92 -2,339 -2,629 -843 -334 -10,930 -4,301 -354 -406 -50 -276 -32,319. 1992-93 -1,476 -3,324 -592 -566 -12,428 -5,030 -264 -617 -82 -261 -39,019. 1993-94 -899 -1,371 -272 -431 -11,202 -4,923 -266 -546 -71 -205 -38,530.
3 1994-95 -228 938 128 -196 -10,129 -5,821 -79 -233 -1 -374 -36,632. 1995-96 -317 1,151 19 157 -8,800 -3,947 41 -201 4 -190 -30,006. 1996-97 -753 2,489 407 91 -6,905 -3,212 66 -116 -4 -107 -8,719. 1997-98 -167 2,659 35 76 -3,966 -2,157 0 -443 -7 133 2,959. 1998-99 -961 1,094 28 31 -2,002 126 -204 -262 6 -187 5,779. 1999-00 -13 2,791 83 11 668 7 -30 -797 -5 -269 14,258. 2000-01 1,198 6,571 58 40 1,902 427 43 147 -12 -350 19,891. 2001-02 -1,035 1,081 -483 63 375 22 79 113 -17 -468 8,048. 2002-03 -2,621 2,133 -654 4 117 -728 1 28 -55 -644 6,621. 2003-04 -1,342 4,136 -100 -579 -5,483 -358 -197 37 -125 -914 9,145. 2004-05 2,689 5,175 844 562 -1,555 -664 221 170 -34 -489 1,463. 2005-06 2,963 8,551 679 394 298 37 225 196 1 199 13,218. 2006-07 3,973 8,510 574 485 2,269 109 277 183 24 154 13,752. 2007-08 2,746 4,581 1,873 558 600 0 241 419 -4 1,421 9,597. 2008-09 73 -931 2,968 449 -6,409 119 -152 27 -31 2,350 -9,116. 2009-10 -1,812 -476 -409 -185 -19,262 -3,607* -695 -269 -74 -33 -56,368. 2010-11 -247 -2,262 -13 -181 -14,011 -3,150* -617 585 -63 598 -34,953.
4 2011-12 -1,850 -114 -105 -1,001 -15,408 -2,628* -244 -259 -84 974 -28,033. 2012-13 -1,168 -3,099 37 -560 -10,662 -1,600* -533 -302 -80 -195 -21,293. 2013-14 327 -302 589 -600 -11,530 -2,824* -600 -677 -46 -389 -8,050. 2014-15 1,692 1,115 62 -539 -11,268 -725* -361 -144 -20 -1,006 -550. 2015-16 811 -6,442 -1,519 -932 -5,346 2,191* -261 -13 -13 -2,206 -2,861. 2 0 1 6 -1 7 2,727 -1 0 , 7 8 4 -1 , 2 1 8 -7 8 9 -2 , 4 3 5 2,361* -1 1 7 151 -1 -1 , 1 4 8 -1 8 , 9 5 7. 2 0 1 7 -1 8 301 -8 , 0 2 3 -3 0 3 -6 9 5 -3 , 6 7 2 2,622* 67 230 75 -9 1 1 -1 8 , 9 6 1 *. 2 0 1 8 -1 9 374* -6 , 9 3 0 * -3 8 0 * -4 7 0 * -1 1 , 7 0 0 * 2,500* 5* 28* 4 -5 2 2 * -1 4 , 9 0 0 *. 2 0 1 9 -2 0 274* -7 , 9 0 0 * 34* -3 6 0 * -1 0 , 3 0 0 * 2,504* 23* 34* 3 1,925* -1 9 , 8 0 0 *. 2 0 2 0 -2 1 287* -7 , 1 0 0 * 49* -6 , 8 0 0 * 0* 33* 52* 4 -7 9 6 * -1 9 , 7 0 0 *. Pr o jec ted 2 0 2 1 -2 2 585* -5 , 3 0 0 * 72* -5 , 6 0 0 * 0* 63* 66* -3 0 0 * -1 4 , 8 0 0 *. 2 0 2 2 -2 3 -2 , 9 0 0 * 84* -3 , 5 0 0 * 100* 71* 73* 23* -1 2 , 1 0 0 *.
5 2 0 2 3 -2 4 900* 300* 450* -9 , 8 0 0 *. 2 0 2 4 -2 5. 2 0 2 5 -2 6. 1. Public accounts basis. Numbers are based on reports from individual governments and, due to accounting and/or reporting differences, are not strictly comparable between provinces. 2. 2008-09 figures onwards are presented as current Alberta government framework 3. Numbers for years prior to 2001-02 in Saskatchewan are on a General Revenue Fund (GRF) basis and not comparable to other years. 4. Numbers for years prior to 2010-11 in Manitoba are not comparable to other years. 5. Numbers for years prior |toRESEARCH. 2 RBC ECONOMICS 2009-10 in Quebec are not comparable to other years. Source: Fiscal reference Tables (Department of Finance Canada), various Provincial budgets, budget updates and public accounts. *Recently Updated FOCUS ON CANADA'S HOUSEHOLD DEBT | MARCH 26, 2018. Provincial budget balances relative to GDP1 , %.. ALT A 2 SASK MAN ONT QUE 5 P . Fe d e ral La st up d a te d 19-Feb-19 27-Feb-19 20-Mar-19 07-Mar-19 11-Apr-19 21-Mar-19 19-Mar-19 26-Mar-19 23-Nov-18 16-Apr-19 19-Mar-19.
6 1981-82 1982-83 1983-84 1984-85 1985-86 1986-87 A c tu al ( n o adju s tmen ts made w ith r es pec t to ac c o u n tin g o r o th er c h an g es ). 1987-88 1988-89 1989-90 1990-91 1991-92 1992-93 1993-94 1994-95 1995-96 1996-97 1997-98 1998-99 1999-00 2000-01 2001-02 2002-03 2003-04 2004-05 2005-06 2006-07 2007-08 2008-09 2009-10 * 2010-11 * 2011-12 * 2012-13 * 2013-14 * 2 0 1 4 -1 5 -0 . 8 -1 . 6 -0 . 2 * -1 . 1 -0 . 4 -0 . 3 -2 . 9 2 0 1 5 -1 6 -2 . 0 -1 . 9 -1 . 4 -0 . 7 * -0 . 8 -0 . 2 -7 . 1 2 0 1 6 -1 7 -3 . 6 -1 . 6 -1 . 2 -0 . 3 * -0 . 3 -3 . 6 -0 . 9. 2 0 1 7 -1 8 -2 . 4 -0 . 4 -1 . 0 -0 . 4 * -2 . 8 -0 . 9 *. 2 0 1 8 -1 9 * -2 . 0 * -0 . 5 * -0 . 6 * -1 . 4 * * * * -1 . 5 * -0 . 7 *. Pr o jec ted 2 0 1 9 -2 0 * -2 . 2 * * -0 . 5 * -1 . 2 * * * * * -0 . 9 *. 2 0 2 0 -2 1 * -1 . 8 * * -0 . 7 * * * * -2 . 2 * -0 . 8 *. 2 0 2 1 -2 2 * -1 . 3 * * -0 . 6 * * * -0 . 8 * -0 . 6 *. 2 0 2 2 -2 3 -0 . 7 * * -0 . 4 * * * * -0 . 5 *. 2 0 2 3 -2 4 * * * -0 . 4 *. 1. Public accounts basis.
7 Numbers are based on reports from individual governments and, due to accounting and/or reporting differences, are not strictly comparable between provinces. 2. 2008-09 figures onwards are presented as current Alberta government framework 3. Numbers for years prior to 2001-02 in Saskatchewan are on a General Revenue Fund (GRF) basis and not comparable to other years. 4. Numbers for years prior to 2010-11 in Manitoba are not comparable to other years. 5. 3. Numbers for years prior to 2009-10 in Quebec are not comparable to other years. Source: Fiscal reference Tables (Department of Finance Canada), various Provincial budgets, budget updates and public accounts. *Recently Updated FOCUS ON CANADA'S HOUSEHOLD DEBT | MARCH 26, 2018. Revenues1, % Change . ALT A 2 SASK 4 MAN ONT QUE 7 5. P . Fe d e ral La st up d a te d 19-Feb-19 27-Feb-19 20-Mar-19 07-Mar-19 11-Apr-19 21-Mar-19 19-Mar-19 26-Mar-19 23-Nov-18 16-Apr-19 19-Mar-19. 1981-82 1982-83 1983-84 1984-85 1985-86 A c tu al ( n o adju s tmen ts made w ith r es pec t to ac c o u n tin g o r o th er c h an g es ).
8 1986-87 1987-88 1988-89 1989-90 1990-91 1991-92 1992-93 1993-94 1994-95 1995-96 1996-97 1997-98 1998-99 1999-00 2000-01 2001-02 2002-03 2003-04 2004-05 2005-06 2006-07 2007-08 2008-09 2009-10 * 2010-11 * 2011-12 * 2012-13 * 2013-14 * 2014-15 * 2015-16 * 2 0 1 6 -1 7 -0 . 8 -0 . 1 * -0 . 7. 2 0 1 7 -1 8 * *. 2 0 1 8 -1 9 * * * * * * * -1 . 0 * * *. 2 0 1 9 -2 0 * * * * * * * * * *. 2 0 2 0 -2 1 * * * * * * * -2 7 . 9 * *. Pr o jec ted 2 0 2 1 -2 2 * * * * * * * * *. 2 0 2 2 -2 3 * * * * * * * *. 2 0 2 3 -2 4 * * * *. 2 0 2 4 -2 5. 2 0 2 5 -2 6. 1. Public accounts basis. Numbers are based on reports from individual governments and, due to accounting and/or reporting differences, are not strictly comparable between provinces. 2. 2008-09 figures onwards are presented as current Alberta government framework 3. Revenue numbers for 2015-16 and 2016-17 include net income from government business enterprises. 4. Numbers for years prior to 2001-02 in Saskatchewan are on a General Revenue Fund (GRF) basis and not comparable to other years.
9 5. Revenue numbers for years starting from 1997-98 include net income from government business enterprises and are not comparable to prior years. 6. Numbers for years prior to 2010-11 in Manitoba are not comparable to other years. 7 4 RBC ECONOMICS. Numbers for years prior| to RESEARCH. 2009-10 in Quebec are not comparable to other years. Source: Fiscal reference Tables (Department of Finance Canada), various Provincial budgets, budget updates and public accounts. *Recently Updated FOCUS ON CANADA'S HOUSEHOLD DEBT | MARCH 26, 2018. Revenues relative to GDP1, %.. ALT A 2 SASK MAN ONT QUE 7 5. P . Fe d e ral La st up d a te d 19-Feb-19 27-Feb-19 20-Mar-19 07-Mar-19 11-Apr-19 21-Mar-19 19-Mar-19 26-Mar-19 23-Nov-18 16-Apr-19 19-Mar-19. 1981-82 1982-83 1983-84 1984-85 1985-86 A c tu al ( n o adju s tmen ts made w ith r es pec t to ac c o u n tin g o r o th er c h an g es ). 1986-87 1987-88 1988-89 1989-90 1990-91 1991-92 1992-93 1993-94 1994-95 1995-96 1996-97 1997-98 1998-99 1999-00 2000-01 2001-02 2002-03 2003-04 2004-05 2005-06 2006-07 2007-08 2008-09 2009-10 * 2010-11 * 2011-12 * 2012-13 * 2013-14 * 2 0 1 4 -1 5 * 2 0 1 5 -1 6 * 2 0 1 6 -1 7 * 2 0 1 7 -1 8 * *.
10 2 0 1 8 -1 9 * * * * * * * * * *. 2 0 1 9 -2 0 * * * * * * * * * *. Pr o jec ted 2 0 2 0 -2 1 * * * * * * * * *. 2 0 2 1 -2 2 * * * * * * * *. 2 0 2 2 -2 3 * * * * * * *. 2 0 2 3 -2 4 * * * *. 1. Public accounts basis. Numbers are based on reports from individual governments and, due to accounting and/or reporting differences, are not strictly comparable between provinces. 2. 2008-09 figures onwards are presented as current Alberta government framework 3. Revenue numbers for 2015-16 and 2016-17 include net income from government business enterprises. 4. Numbers for years prior to 2001-02 in Saskatchewan are on a General Revenue Fund (GRF) basis and not comparable to other years. 5. Revenue numbers for years starting from 1997-98 include net income from government business enterprises and are not comparable to prior years. 6. Numbers for years prior to 2010-11 in Manitoba are not comparable to other years. 7 5. Numbers for years prior to 2009-10 in Quebec are not comparable to other years.
