Transcription of Cancer Facts & Figures 2019
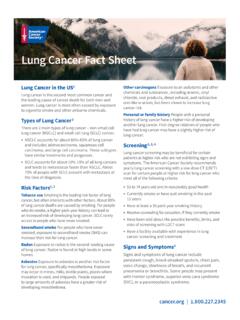
1 AL28,950AZ37,49 0AR16,580CA186,920CO26,800CT 21,950DE 5,870FL131,470GA50,450ID8,390IL68,560IN3 5,280IA17, 810KS15,340KY26,400LA26,800ME8,920MD 33,14 0MA40,020MN30,560MS17,050MO35,480MT5,920 NE9,780NV14,810NH8,610NJ 53,400NM9,460NY111, 870NC58,690ND3,940OH67,150OK20,540OR23,3 20PA79,890RI 6,540SC29,830SD4,770TN37,350TX124,89 0UT11,6 20VT3,920VA45,440WA39,160WV12,4 4 0WI34,220WY2,930DC 3,19 0HI7,120AK3,090MI58,360 PRN/AUS1,762,450 Estimated numbers of new Cancer cases for 2019, excluding basal cell and squamous cell skin cancers and in situ carcinomas except urinary are not available for Puerto : State estimates are offered as a rough guide and should be interpreted with caution. State estimates may not add to US total due to Facts & Figures2019 Special Section: Cancer in the Oldest Oldsee page 29 ContentsBasic Cancer Facts 1 Figure 1. Trends in Age-adjusted Cancer Death Rates by Site, Males, US, 1930-2016 2 Figure 2. Trends in Age-adjusted Cancer Death Rates by Site, Females, US, 1930-2016 3 Table 1.
2 Estimated Number of New Cancer Cases and Deaths by Sex, US, 2019 4 Table 2. Estimated Number of New Cases for Selected Cancers by State, US, 2019 5 Table 3. Estimated Number of Deaths for Selected Cancers by State, US, 2019 6 Table 4. Incidence Rates for Selected Cancers by State, US, 2011-2015 7 Table 5. Death Rates for Selected Cancers by State, US, 2012-2016 8 Selected Cancers 9 Figure 3. Leading Sites of New Cancer Cases and Deaths 2019 Estimates 10 Table 6. Probability (%) of Developing Invasive Cancer during Selected Age Intervals by Sex, US, 2013-2015 14 Table 7. Trends in 5-year Relative Survival Rates (%) by Race, US, 1975-2014 18 Table 8. Five-year Relative Survival Rates* (%) by Stage at Diagnosis, US, 2008-2014 21 Special Section: Cancer in the Oldest Old 29 Figure S1. Age Distribution of US Population in Millions: 2016 versus 2060 29 Figure S2. Average Annual Incidence Rates and Case Distribution by Age, US, 2011-2015 30 Table S1.
3 Leading Cancer Sites of New Cancer Cases and Deaths, Ages 85+, US 31 Figure S3. Cancer Incidence and Mortality Rates among Adults 85+ by Race/Ethnicity, US, 2011-2016 32 Figure S4. Trends in Cancer Incidence and Death Rates by Sex, Ages 85+, US, 1975-2016 33 Figure S5. Trends in Cancer Incidence Rates for Selected Sites, Ages 85+, US, 1995-2015 34 Table S2. Joinpoint Trends in Cancer Incidence Rates for Selected Sites in Two Age Groups, US, 1995-2015 35 Figure S6. Trends in Cancer Death Rates for Selected Sites, Ages 85+, US, 1975-2016 36 Figure S7. Stage Distribution (%) for Selected Cancers in Two Age Groups, US, 2008-2014 37 Table S3. Screening Prevalence (%) among Adults 85+, US, 2015 38 Figure S8. Five-year Relative Survival for Selected Cancers in Two Age Groups, US, 2008-2014 39 Figure S9. Receipt of Surgical Treatment for Selected Cancers in Two Age Groups, US, 2011-2015 40 Tobacco Use 44 Figure 4. Proportion of Cancer Deaths Attributable to Cigarette Smoking in Adults 30 Years and Older, US, 2014 44 Excess Body Weight, Alcohol, Diet & Physical Activity 49 Cancer Disparities 52 Table 9.
4 Incidence and Mortality Rates for Selected Cancers by Race and Ethnicity, US, 2011-2016 54 The Global Cancer Burden 55 The American Cancer Society 58 Sources of Statistics 69 American Cancer Society Recommendations for the early detection of Cancer in Average-risk Asymptomatic People 71 Global Headquarters: American Cancer Society Inc. 250 Williams Street, NW, Atlanta, GA 30303-1002 404-320-3333 2019, American Cancer Society, Inc. All rights reserved, including the right to reproduce this publication or portions thereof in any written permission, address the Legal department of the American Cancer Society, 250 Williams Street, NW, Atlanta, GA publication attempts to summarize current scientific information about Cancer . Except when specified, it does not represent the official policy of the American Cancer citation: American Cancer Society. Cancer Facts & Figures 2019. Atlanta: American Cancer Society; Facts & Figures 2019 1 Basic Cancer FactsWhat Is Cancer ?
5 Cancer is a group of diseases characterized by the uncontrolled growth and spread of abnormal cells. If the spread is not controlled, it can result in death. Although the causes of Cancer are not completely understood, numerous factors are known to increase the disease s occurrence, including many that are modifiable ( , tobacco use and excess body weight) and those that are not ( , inherited genetic mutations and immune conditions). These risk factors may act simultaneously or in sequence to initiate and/or promote Cancer Cancer Be Prevented?A substantial proportion of cancers could be prevented, including all cancers caused by tobacco use and other unhealthy behaviors. According to a recent study by American Cancer Society researchers, at least 42% of newly diagnosed cancers in the US about 740,000 cases in 2019 are potentially avoidable, including the 19% of all cancers that are caused by smoking and the 18% that are caused by a combination of excess body weight, physical inactivity, excess alcohol consumption, and poor nutrition.
6 Certain cancers caused by infectious agents, such as human papillomavirus (HPV), hepatitis B virus (HBV), hepatitis C virus (HCV), and Helicobacter pylori (H. pylori), could be prevented through behavioral changes or vaccination to avoid the infection, or treatment of the infection. Many of the more than 5 million skin Cancer cases that are diagnosed annually could be prevented by protecting skin from excessive sun exposure and not using indoor tanning can help prevent colorectal and cervical cancers by detecting precancerous lesions that can be removed. It can also detect some cancers early , when treatment is more often successful. Screening is known to help reduce mortality for cancers of the breast, colon, rectum, cervix, prostate , and lung (among current or former heavy smokers). In addition, a heightened awareness of changes in certain parts of the body, such as the breast, skin, mouth, eyes, or genitalia, may also result in the early detection of Cancer .
7 For complete Cancer screening guidelines, see page Many People Alive Today Have Ever Had Cancer ?More than million Americans with a history of Cancer were alive on January 1, 2016, most of whom were diagnosed many years ago and have no current evidence of Many New Cases and Deaths Are Expected to Occur in 2019?More than million new Cancer cases are expected to be diagnosed in 2019 (Table 1). This estimate does not include carcinoma in situ (noninvasive Cancer ) of any site except urinary bladder, nor does it include basal cell or squamous cell skin cancers because these are not required to be reported to Cancer registries. Table 2 provides estimated new Cancer cases in 2019 by 606,880 Americans are expected to die of Cancer in 2019 (Table 1), which translates to about 1,660 deaths per day. Cancer is the second most common cause of death in the US, exceeded only by heart disease. Table 3 provides estimated Cancer deaths by state in Much Progress Has Been Made against Cancer ?
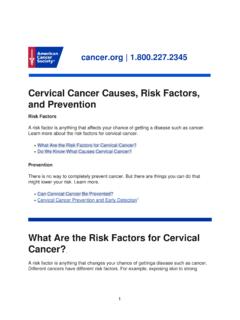
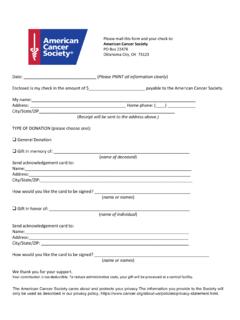
8 Cancer death rates are the best measure of progress against the disease because they are less affected by detection practices than incidence and survival. The overall age-adjusted Cancer death rate rose during most of the 20th century, peaking in 1991 at 215 Cancer deaths per 100,000 people, mainly because of the tobacco epidemic. As of 2016, the rate had dropped to 156 per 100,000 (a decline of 27%) because of reductions in smoking, as well as improvements in early detection and treatment. This decline translates into more than million fewer Cancer deaths from 1991 to 2016, progress that has been driven by steady declines in death rates for the four most common Cancer types lung, colorectal, breast, and prostate (Figure 1 and Figure 2).2 Cancer Facts & Figures 2019Do Cancer Incidence and Death Rates Vary by State?Table 4 and Table 5 provide average annual incidence (new diagnoses) and death rates for selected Cancer types by state.
9 Lung Cancer rates vary the most by state, ref lecting historical differences in smoking prevalence that continue Is at Risk of Developing Cancer ? Cancer usually develops in older people; 80% of all cancers in the United States are diagnosed in people 55 years of age or older. Certain behaviors also increase risk, such as smoking, having excess body weight, and drinking alcohol. In the US, approximately 39 out of 100 men and 38 out of 100 women will develop Cancer during their lifetime (Table 6). These probabilities are estimated based on Cancer occurrence in the general population and may overestimate or underestimate individual risk because of differences in exposures ( , smoking), family history, and/or genetic susceptibility. For most types of Cancer , risk is higher with a family history of the disease. This is thought to result primarily from the inheritance of genetic variations that confer low or moderate risk and/or similar exposures to lifestyle/environmental risk factors among family members, as opposed to inheritance of genetic alterations that confer a very high risk, which occurs much more risk is the strength of the relationship between exposure to a given risk factor and Cancer .
10 It is measured by comparing Cancer occurrence in people with a certain exposure or trait to Cancer occurrence in people without this characteristic. For example, men and women who smoke are about 25 times more likely to develop lung Cancer than nonsmokers, so the relative risk of lung Cancer among smokers is 25. Most relative risks are not this large. For example, women who have a mother, sister, or daughter with a history of breast Cancer are about twice as likely to develop breast Cancer as women who do not have this family history; in other words, their relative risk is about 2. *Per 100,000, age adjusted to the 2000 US standard population. Mortality rates for pancreatic and liver cancers are : Due to changes in ICD coding, numerator information has changed over time. Rates for cancers of the liver, lung and bronchus, and colon and rectum are affected by these coding : US Mortality Volumes 1930 to 1959, US Mortality Data 1960 to 2016, National Center for Health Statistics, Centers for Disease Control and Prevention.