Transcription of Capgemini case study: building from expertise - using in ...
1 1 Capgemini case study: building from expertise - using in-house talent to create a new approach to managing and using data. Capgemini employs over 180,000 people across 40 countries and is a global provider of consulting, technology and outsourcing services. Built around highly experienced and skilled technical experts, the organisation relies fully on the expertise of its workforce to drive performance and continue its trend of strong financial performance. The challenges that Capgemini face are similar to those of many operating in the fluid and uncertain economic and social environment in which global organisations must now function. For a business with such reliance on human, knowledge and intellectual capital, there is a firm desire from the leadership teams to understand more about the workforce, and how they can be mobilised through HR activity, to increase the productivity and performance of the business.
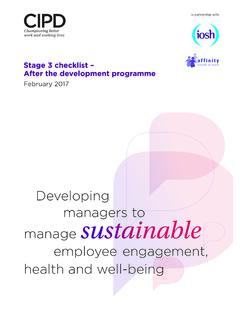
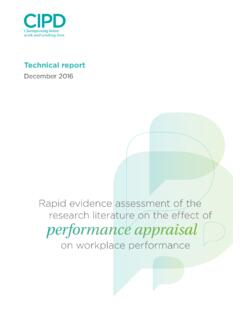
2 The business does, however, have to tackle some of the common challenges other businesses will recognise, not least the issue of siloed working, which can prevent teams from collaborating and working more productively together. Nowhere is this truer than in the HR function, where the different activities which the HR teams manage sit separately to one another with varying degrees of overlap and cohesion. This structural and functional separation of activity meant that the way teams connect and use data was also very different. Reporting was ad hoc and piecemeal, and the language that the business used to speak about people concepts was equally disjointed (Figure 1). Keen to draw value from the organisation s extensive HR data estate, which was of good quality but siloed, HR Business Partner Maja Luckos saw the potential for an alternative approach at the CIPD HR Analytics Conference in 2014: We have always done the same thing, as have most organisations, which is to report on the past by producing static reports, using multiple data systems which are not integrated.
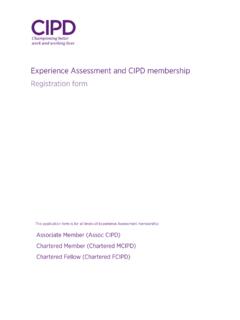
3 As the systems are separate, we naturally report in silos; so L&D is reported separately, as is recruitment etc. Everything is collated monthly to review progress against our KPIs. Everyone produces their own slide which tells a different story on headcount etc. So I saw the need to change this because at the end of the day we re working as one organisation with one set of KPIs and one HR agenda. I really started thinking, How can we pull it all together into one version of the truth? . Maja Luckos, HR Business Partner 2 Figure 1: Management of data before the change Maja s vision was to enable better informed decisions by the business at the point of action, through a completely new approach to HR analytics; to find an alternative to spreadsheets that would use engaging and meaningful visualisations, facilitating dynamic and real time data discovery driven by the user (Figure 2).
4 Getting started: finding expertise and experience and building buy-in The first step on the journey was to generate an appetite for this new approach from the HR Directors and convince them of its achievability. I started by approaching the Insights and Data team who work with our clients to build analytics products and solutions. They were very supportive of the idea and instantly connected me with Qlik, one of our partners. After discussing our requirements, Qlik saw the potential and gave me access to a consultant for a couple of days, free of charge, to build a proof of concept. Maja Luckos, HR Business Partner building a proof of concept for the tool was the first major step in moving from ideas to implementation. Three simple applications were built over the course of the two days with the Qlik consultant, focusing on Attrition, Talent and L&D. All were underpinned by the same data feed from Oracle HR, providing a consistent picture throughout.
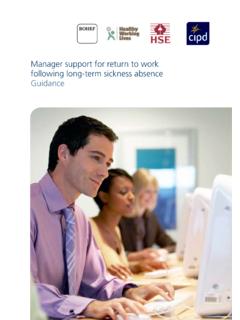
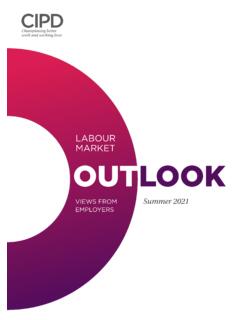
5 It was important to prepare thoroughly before meeting with the consultant, organising the data and making decisions on the key areas that would instantly grab attention, in addition to the most critical KPIs. 3 Talent was definitely key. We re quite good at identifying our talent, using a nine box grid that is well established. We designed one example for talent that was dynamic so you could pick and choose different dimensions, grade, and the application would tell you how many of the population were in each position on the grid (Figure 3). This immediately highlighted some inconsistencies in the data, which helped to show how useful the tool could be. You could also understand the succession pipeline; which is something that the HR Leadership team liked. Maja Luckos, HR Business Partner The applications were presented to the HR Leadership team and they were instantly sold on the approach.
6 Seeing their own data presented in this new way really captured their imagination and they agreed to invest in further development of the tool. The aim was defined; to build one application covering all key HR areas; Headcount, Talent Management, Attrition, Career & Employability, Recruitment, Sickness & Absence and L&D. Defining the audience and the users for the tool was also critical during this scoping phase. Whilst the HR team knew that they needed to gain better insights from their people data, there was little understanding of how the tool could be used by other functions. A process of consultation was undertaken to ascertain exactly how the business may use the data, and what format the final tool should take to deliver the best insights. There were two intended types of primary user for the tool so we initially rolled it out to the HR teams that would benefit most as they work closely with decision makers in the business, but also eventually wanted to share it with the line managers, team leaders and capability leads, who manage large teams of 50 plus people, so they could use the insights to better inform decisions.
7 Maja Luckos, HR Business Partner Setting up definitions The model had to be able to compute data from various established systems and data sets which were already well used across HR and other business functions. Integrating these established systems was a significant undertaking which took considerable time: We had to include a few different data sets the biggest one came from our Oracle HR system, which is very comprehensive and holds good quality data. This accounts for around 70% of the data requirement in the application. The rest came from different data owners across other functions which took a little longer as we needed to get their buy in to feed into the process. For example, you have to get your respective Heads of Talent, Recruitment, L&D etc. involved and excited about this as well. Maja Luckos, HR Business Partner Then the process of setting up definitions began.
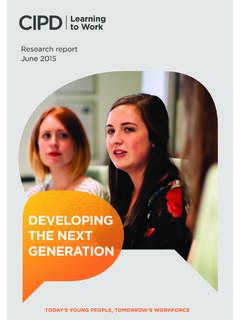
8 Maja and her colleagues had to define the measures that were to be computed in the system, according to those who were running the analytics, and those who would be using the outputs. Deciding which elements needed to be measured was also an important consideration, as there are various measures that can be applied, often for the same concept. Maja recommends focusing on the priority measures, which can be understood more by considering: 4 Figure 2: Management of data through QlikView Once we had requirements we had to go through the process of defining what each measure was, so what recruitment cost equals, and the formula you would use to calculate it. You end up with a long list which must be prioritised. I think you have to constantly challenge yourself; what is the value in looking at those KPIs? Why should we be measuring this process? Maja Luckos, HR Business Partner Through exploring how the business understands specific HR terms, the team soon realised that there were few set definitions that ran across all functions and HR teams.
9 This meant there was no common language when talking about people measures, either within HR or with colleagues from other functions including finance: We found that in some parts of the business the definition for Top Talent differed to ours. So although we have a similar 9 box grid, we define two of our boxes as Top Talent while they just include the top right hand one. So we had to factor these differences in so that anybody could use the tool. Michelle Steele, HR Business Partner building the tool Once the scope, definitions and data feeds were agreed, the structure of the tool could be put in place. The design of the tool was incredibly important as it had to be easy to use and understand, whilst illustrating data in a clear and coherent way. The application was built section by section by a QlikView Developer, keeping in touch with the main stakeholders throughout. The main focus was on the data model as it was the quality of this that would give users the freedom to draw real insights from the data.
10 Maja and other team members also attended the QlikView Designer training course so they could adapt the tool themselves. 5 Figure 3: HR dashboard: Talent 9 box grid Figures provided for illustrative purposes only Figure 4: HR dashboard: Top measures Figures provided for illustrative purposes only 6 The application consists of one dashboard which illustrates key performance indicators, and seven areas of interest which Maja defined through a consultation exercise across the business (Figure 4). She looked to the different functions that were already using the data in spreadsheet format to appreciate which particular areas should be considered as key themes in the data model. The main area of the tool holds the key performance indicators, and then linked to this are seven analysis areas; Headcount, Talent Management, Leavers, Joiners, Recruitment, Sickness & Absence, and Learning & Development.