Transcription of Capital IQ Quick Start Guide - University of Toronto
1 Capital IQ Quick Start Guide 1 Table of Contents Introduction .. 2 What is Capital IQ? .. 2 My Capital 2 Instructions: .. 2 Key Functions .. 3 Report Builder .. 3 Companies .. 4 5 Estimates .. 6 Markets .. 7 Screening .. 8 2 Introduction What is Capital IQ? Capital IQ is a web and excel -based financial research application produced by Standard & Poor s. It organizes historical information on companies, markets, transactions, and people worldwide, providing clients with the data necessary to analyze company fundamentals, build financial models, screen for investment ideas, and execute other financial research tasks.
2 Some user-friendly features are its chart builder, screening tool and excel Plug-in modeling tools. This document focuses on the basics of Capital IQ and aims to provide a Guide for the beginner user and act as a reference for the experienced user. Capital IQ is organized by six Top Menu options - My Capital IQ, Companies, Markets, Screening, Charting, and Coverage. My Capital IQ Instructions: When you open Capital IQ from the desktop icon, the web-based software is automatically logged in and ready to use, opening to the My Capital IQ page. Every Capital IQ page follows the same layout: Top Menu Bar: provides access to other feature of Capital IQ such as Companies , Markets , Screening , Charting , and Coverage.
3 Left Menu: list of functions that are specific to each option of the Top Menu bar Body: displays selected information 3 Key Functions Report Builder Capital IQ s has many user-friendly features including the Report Builder. This function allows clients to develop a custom formatted report of their Capital IQ findings. 4 Companies Company Intelligence provides comprehensive information on over 60,000 public companies, 685,000 private companies, 10,600 private Capital firms, 312,000 transactions and 985,000 professionals worldwide. To search for a company, either: 1. Click on the Companies tab in the Top Menu and select the Search Profiles option 2.
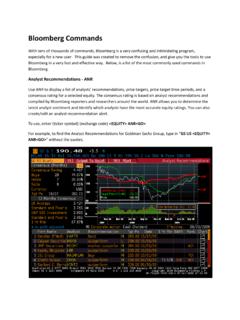
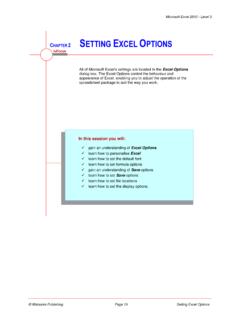
4 Use the Search Box at the top of the page, above the Top Menu Clients are presented with a list of matches from which they can choose their desired company, and will then be directed to its Tearsheet. The Tearsheet page provides a company s basic business description, industry classification, current and prior investors, primary office location, stock information, financial statistics, key executives and current and pending subsidiaries. Below is a screenshot of Apple Inc. s Tearsheet: 5 Financials/Valuation This function on the left menu provides a detailed list of financial information used to analyze and valuate companies.
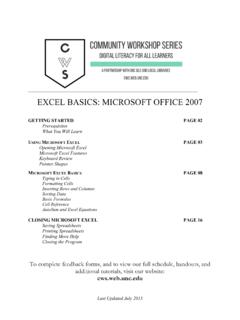
5 In the image below, outlined in red, you can find key statistics, Income Statement, Balance Sheet, and much more. Users also have the option to download this information in an excel sheet for further analysis. The button for download is below the Top menu, outlined in blue on the below diagram. 6 Estimates This page summarizes analysts predictions for the company. The Estimates page provides current pricing information, buy or sell recommendations, long-term growth rate %, and other estimate information. The screenshot below shows the Estimates page for Apple Inc.
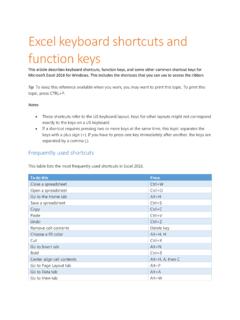
6 : 7 Markets The Market Analysis page provides a Quick analysis on the entire industry, divided into ten major sectors, as well as in-depth research on selected sectors. Two of the most useful sections are: Industry Performance highlights some of the best and worst performing industries. In addition, users can view a graph comparing the performance of ten major sectors to the S&P 500 Index. Sector Performance - lists key financials and ratios to give users a clear picture of the position of each industry in the market. Below is screenshot of the Market Page: 8 Screening This feature allows users to find comparable companies, people, key developments, and transactions according to a wide selection of screening data points.
7 To access this feature, go to the Top Menu and click on Screening. Company Screening full in-depth screening tool that allows you to screen companies based on hundreds of characteristics. Key Developments screen for companies by corporate actions SEC filings, bankruptcies, transactions. Idea Generation Screens- find potential M&A opportunities, undervalued companies, distressed or potentially distressed situations, arbitrage situations, and more. Transaction Screening Screen companies by M&A transactions, Growth Capital transactions, Equity Buybacks, PIPE transactions, new issues, and transaction details.
8 Basic Screener quickly screen companies based on a few attributes. 9 The Company Screening page allows clients to select and apply filter options for company data. Clicking on a criterion link opens the category field at the bottom of the page with filtering options - typically a list of available company characteristics or inequalities for numerical data. Choose the desired items you wish to screen on and set up the values as required. Then click Add Criteria. Below is a screenshot highlighting the numerous options to narrow down your search result.