Transcription of Capps Fall 2013 - Test #1 ANSWER KEY
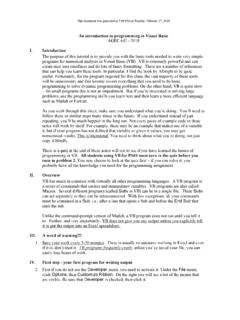
1 AGEC 105 Capps Fall 2013 - Test #1 ANSWER KEY (correct answers are in red) Please put the following pieces of information on your scantron: (a) Name (b) UIN # (c) Section #: 504 505 506 (d) Sign the Aggie pledge on the back of your scantron. On my honor, as an Aggie, I have neither given nor received unauthorized aid on this exam. AGEC 105 Fall 2013 Test #1 Capps 1. Scarce resources like land, labor, and capital can be categorized as: (a) human resources (c) manufactured resources (b) natural and biological resources (d) all the above 2. Which of the following statement(s) is (are) false? (a) The number of farms at present is about 2 million. (b) The average size of farms is between 800 and 1,000 acres. (c) At present, most farms are organized as partnerships and corporations. (d) Both (b) and (c). 3. Which of the following diagrams best illustrates the immediate impact of a food safety scare due to Salmonella infections of chicken?
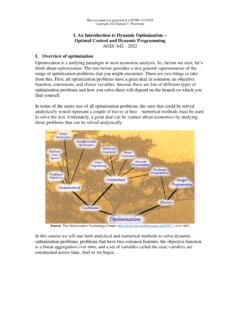
2 (Note: D0 is the original relationship and D1 is the new relationship.) (a) (b) (c) (d) 4. Given the diagram below, what can you conclude? (a) The diagram pertains to a demand curve. (b) The diagram pertains to a budget line. (c) The diagram pertains to an Engel curve for any inferior good. (d) Can t tell; insufficient information. 5. Economic reasoning that is true for one individual but not for society as a whole is referred to as: (a) Fallacy of composition (c) Opportunity cost (b) Specialization (d) None of the above 6. What branch of economics is concerned with the effects of nutrition labeling on the dietary quality of consumers ( what-if types of questions)? (a) normative economics (c) microeconomics (b) positive economics (d) macroeconomics Pchicken Qchicken D0 D1 Pchicken Qchicken D1 D0 Pchicken Qchicken A B D0 Pchicken Qchicken A B D0 D D D C B A Page 2 AGEC 105 Fall 2013 Test #1 Capps 7.
3 An agribusiness firm may undertake three alternatives: (i) buy cane sugar and manufacture various sugars and sweets, making a profit of $12 million; or (ii) buy corn and produce ethanol, making a profit of $16 million; or (iii) buy wheat and produce breads, rolls, and pastries, making a profit of $13 million. The opportunity cost associated with these three choices is: (a) $3 million (c) $13 million (b) $4 million (d) $16 million 8. Congress commissioned a study to determine what the poverty level or minimum level for subsistence should be for the population. To what branch of economics does this study correspond? (a) normative economics (c) microeconomics (b) positive economics (d) macroeconomics 9. What branch of economics is concerned with interest rates and the gross domestic product (GDP) of the economy? (a) normative economics (c) microeconomics (b) positive economics (d) macroeconomics 10. Which of the following statements is (are) true?
4 (a) All food and beverage products are normal goods. (b) One out of every ten jobs in the economy is tied to the food and fiber industry. (c) farms tend to be specialized rather than diversified in that about half of the farms produce just one commodity. (d) Both (a) and (c). 11. Which of the following is not true? (a) The own-price elasticity is always negative. (b) Productivity in the farm sector has increased dramatically over the past 50 years. (c) The share of total farm receipts earned by the largest farms has been increasing during the past two decades. (d) None of the above (that is, all statements are true). 12. Which of the following statement(s) is (are) false? (a) The economy represents a purely capitalistic system. (b) The current Secretary of Agriculture is Tom Vilseck. (c) The index most frequently used by economists to measure inflation is the Consumer Price Index. (d) None of the above (that is, all statements are true). 13. Which of the following statements is false?
5 (a) Agricultural economics is an applied social science. (b) The rational consumer maximizes satisfaction subject to a budget constraint. (c) Regardless of the commodity, the farmer always receives 20 cents of the dollar spent in food. (d) The Latin phrase ceteris paribus means everything else the same or holding all other factors constant. D D C C C A A Page 3 AGEC 105 Fall 2013 Test #1 Capps Consider the information below for a rice farm in the Beaumont area in answering questions 14 and 15. Cash receipts from farm marketing $750,000 Receipts of government payments $150,000 Other income from farm sources $100,000 Production expenses $400,000 Value of real estate assets $10 million Value of non-real estate assets $2 million Financial assets $4 million Liabilities $9 million 14. Net farm income for this operation is: (a) $600,000 (c) $7 million (b) $1 million (d) $25 million 15.
6 The equity for this operation is: (a) $600,000 (c) $7 million (b) $1 million (d) $25 million 16. The gross domestic product (GDP) for the economy in 2012 was roughly $ trillion. What was the approximate dollar value associated with the food and fiber industry in 2012? (a) Between $ to $ trillion (c) Between $ to $ trillion (b) Between $ to $ trillion (d) Between $ to $ trillion 17. Assume that for John Paxton, a soybean producer from Iowa, the only source of farm income is from the production of soybeans. Paxton produced 100,000 bushels of soybeans in 2012, receiving $12 per bushel. Assuming this producer had production expenses of $800,000, and assuming the CPI for 2012 was , his real farm income for 2012 was: (a) $400,000 (b) $200,000 (c) $ million (d) Can t tell; insufficient information. Use the table below to ANSWER questions 18 and 19 dealing with the output and price of corn for 2011 and 2012. Year Output (in bushels) Price/Bushel 2011 10,000 $ 2012 12,000 $ 18.
7 Relative to 2011, the price of corn for 2012 was: (a) Higher by 20% (b) Lower by 25% (c) Lower by 20% (d) Higher by 25% D C B B A Page 4 AGEC 105 Fall 2013 Test #1 Capps 19. Which of the following statements is true? (Let 2011 be the base year.) (a) The output index for 2011 is less than 1. (b) The output index for 2012 is (c) The output index for 2012 is (d) The output index for 2012 is 20. According to the following chart, Bundle Bottles of Dr. Pepper Number of wings Total Utility (a) 3 4 24 (b) 2 6 24 (c) 4 5 40 (d) 5 3 30 when total utility is equal to 24, how many bottles of Dr. Pepper will this consumer give up in order to get on more wing? (a) none (c) two (b) one-half (d) Can t tell; insufficient information 21. The marginal utility of a good ( bananas) declines with increases in the consumption of that good. This phenomenon is referred to as the: (a) Law of Diminishing Marginal Utility (b) Engel s Law (c) Law of Demand (d) None of the above 22.
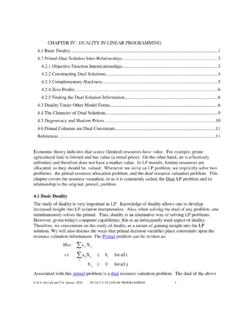
8 As a consumer s income rises, the proportion of income spent on food falls. This assertion is known as: (a) Law of Demand (b) Engel s Law (c) Law of Diminishing Marginal Utility (d) None of the above 23. Suppose the index of prices received by farmers for 2012 was and the base year of this index was 1996. Then: (a) relative to 1996, prices received by farmers were 70% lower in 2012. (b) relative to 2012, prices received by farmers were 70% higher in 1996. (c) relative to 1996, prices received by farmers were 70% higher in 2012. (d) relative to 2012, prices received by farmers were 70% lower in 1996. C C B B A Page 5 AGEC 105 Fall 2013 Test #1 Capps 24. Based on the graph to the right, which of the following is true? (a) 3 units of environmental quality and 6 units of power offer the same level of satisfaction as 4 units of environmental quality and 10 units of power.
9 (b) 5 units of environmental quality and 4 units of power offer the same level of satisfaction as 4 units of environmental quality and 10 units of power. (c) 5 units of environmental quality and 8 units of power offer the same level of satisfaction as 4 units of environmental quality and 10 units of power. (d) none the above. 25. Based on the graph in question 24, which of the following statement(s) is (are) true? (a) The MRS from point A to point B is 1. (b) We cannot compute the MRS from point A to point E. (c) The curves depicted in in the graph are indifference or iso-utility curves. (d) All of the above. 26. The MRS from point B to point C in the above graph must be lower (in absolute value) than the MRS from point A to point B. The reason this statement is true is due to: (a) the law of demand (b) the law of diminishing marginal utility (c) Engel s law (d) none of the above. 27. Which of the following statement(s) is (are) true? (a) The marginal rate of substitution is always negative.
10 (b) Indifference curves never intersect. (c) When total utility reaches a maximum, marginal utility is zero. (d) All of the above 28. Which of the following statement(s) is (are) false? (a) The slope of any budget line is negative and related to the ratio of the prices of the goods in question. (b) The slope of any linear demand curve is the own-price elasticity. (c) The slope of any indifference curve is the MRS. (d) None of the above (that is, all statements are true). 14 D D C B B Page 6 AGEC 105 Fall 2013 Test #1 Capps 29. Suppose a college student can spend $30 on Subway sandwiches and Chick-Fil-A sandwiches. The price of a Subway sandwich is $5 and the price of a Chick-Fil-A sandwich is $3. Which of the following diagrams describes the correct budget line for this student? (a) (b) (c) (d) 30. The following graph depicts: (a) an Engel curve (b) a perfectly elastic demand curve (c) a perfectly inelastic demand curve (d) a budget line 31.