Example: barber

Carbon Dioxide: Pressure - Enthalpy Diagram - …

Carbon dioxide : Pressure - Enthalpy Diagram Melting Line-40-40 oC-20-20t = 0 oC 0202040 40 60 60 80 80 1001001201201401401601601801802002002202 20240 oC240260280 Entropy = kJ/kg,oCs = = 0 Sublimation Line Triple Point ( bar, oC)r = 1200r = 1150r = 1100r = 1050r = 1000r = 900r = 800 Density = 700 kg/m3r = 600r= 500r = 400r = 300r = 200 kg/m3r = 150r = 100r = 75r = 50r = 35 Density = 20 kg/m3r = 10r = 25r =15r = 8r = 61101001,000-500-400-300-200-1000100200 Enthalpy , kJ/kgPressure, BarDrawn with CO2 TabTMA Spreadsheet Add-in for the Thermodynamic and Transport Properties of Carbon DioxideCopyright 1999 ChemicaLogic

Carbon Dioxide: Pressure - Enthalpy Diagram Melting Line-40 o -40 C-2 0-2 0. Title: mollier_chart_met.xls Created Date: 11/10/1999 5:42:45 PM

Tags:

  Chart, Pressure, Carbon, Dioxide, Diagrams, Enthalpy, Carbon dioxide, Pressure enthalpy diagram

Information

Domain:

Source:

Link to this page:

Please notify us if you found a problem with this document:

Other abuse

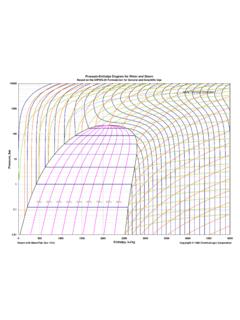
Transcription of Carbon Dioxide: Pressure - Enthalpy Diagram - …

1 Carbon dioxide : Pressure - Enthalpy Diagram Melting Line-40-40 oC-20-20t = 0 oC 0202040 40 60 60 80 80 1001001201201401401601601801802002002202 20240 oC240260280 Entropy = kJ/kg,oCs = = 0 Sublimation Line Triple Point ( bar, oC)r = 1200r = 1150r = 1100r = 1050r = 1000r = 900r = 800 Density = 700 kg/m3r = 600r= 500r = 400r = 300r = 200 kg/m3r = 150r = 100r = 75r = 50r = 35 Density = 20 kg/m3r = 10r = 25r =15r = 8r = 61101001,000-500-400-300-200-1000100200 Enthalpy , kJ/kgPressure, BarDrawn with CO2 TabTMA Spreadsheet Add-in for the Thermodynamic and Transport Properties of Carbon DioxideCopyright 1999 ChemicaLogic


Related search queries