Transcription of Carbon Footprinting - State Street Global Advisors
1 Carbon Footprinting : An Investor ToolkitCarlo M. FunkESG Investment Strategy EMEAM easuring, monitoring and reporting on Carbon emissions can appear very confusing. The recommendations from the European Commission s Technical Expert Group (TEG) on sustainable finance and the Task Force on Climate-related Financial Disclosures (TCFD) have led to several approaches which are currently used in the market place to assess Carbon emissions and calculate company and portfolio-level Carbon educational guide aims to help investors and asset owners understand Carbon pricing and help them build and design portfolios that are aligned with the Paris Agreement goals. In doing so, investors and asset owners can report to their constituents on generally accepted standards, including those of the , Social & Governance (ESG)September 2020 Carbon Footprinting : An Investor Toolkit2 Carbon emissions generally refer to the total greenhouse gas (GHG) emissions caused directly and indirectly by an individual, organisation, event or product.
2 GHGs are atmospheric gases that absorb and emit radiation within the thermal infrared range and that contribute to the greenhouse effect and Global climate change. GHG emissions can be expressed as a Carbon dioxide equivalent (CO2e). Using CO2e as a unit of measurement allows different GHGs to be compared on a like-for-like basis, relative to one unit of Carbon dioxide. Emissions of CO2e are based on the seven GHGs identified by the Kyoto Protocol: Carbon dioxide (CO2) Methane (CH4) Nitrous oxide (N2O) Hydrofluorocarbons (HFCs) Perfluorocarbons (PFCs) Sulphur hexafluoride (SF6) Nitrogen trifluoride (NF3)Each GHG has a different Global warming potential (GWP) and persists for a different length of time in the atmosphere. Aside from Carbon dioxide, the two main GHGs and their 100-year Global warming potential (GWP) are: Methane (CH4) 25 x CO2 Releasing 1kg of methane into the atmosphere is about equivalent to releasing 25kg of CO2.
3 Nitrous oxide (N2O) 298 x CO2 Releasing 1kg of nitrous oxide into the atmosphere is about equivalent to releasing 298kg of give an idea of scale, a typical internal combustion engine vehicle emits about metric tonnes of Carbon dioxide per year, along with much smaller amounts of methane and nitrous The US is estimated to have emitted billion metric tonnes of CO2e in Carbon dioxide accounted for the largest percentage of GHGs (82%), followed by methane (10%), nitrous oxide (6%) and other gases (3%). So, while methane and particularly nitrous oxide are much more potent GHGs, the sheer volume of Carbon dioxide means it has the greatest impact on warming. For a company, quantifying GHG emissions allows an understanding of where the largest emissions arise and how its Carbon footprint can be reduced.
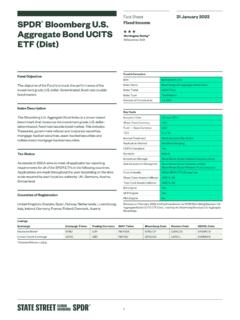
4 Measuring Carbon FootprintsCarbon Footprinting : An Investor Toolkit3 Broadly, there are three types of Carbon footprint for companies:4 An organisational Carbon footprint measures the GHG emissions from all the activities across an organisation, including energy used in buildings, industrial processes and company vehicles. A supply chain Carbon footprint measures the Carbon impacts of the raw materials and services that are purchased by an organisation to deliver its services and/or products. A product Carbon footprint measures the GHG emissions over the whole life of a product from the extraction of raw materials and manufacturing through to its use, recycling or generate emissions from their supply chains to their operations and finally the products/services they produce and FootprintFigure 1 Carbon Footprint for a Typical Company Supply Chain Footprint Organisational FootprintSource: The Carbon OrganisationDistribution of Products and RetailConsumptionRe-use RecyclingDisposalDistribution of Raw MaterialsProduction of Raw MaterialsGreenhouse Gas ProtocolThe Greenhouse Gas (GHG) Protocol Standard is the most widely used greenhouse gas accounting and reporting standard.
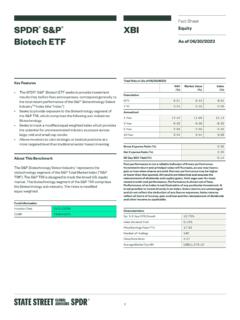
5 The GHG Protocol categorises emissions into three scopes : Scope 1: Direct emissions from owned or controlled sources. Examples: Fuel combustion and company vehicles. Scope 2: Indirect emissions from purchased electricity, steam, heating and cooling consumed by the reporting company. Examples: Purchased electricity and heating. Scope 3: All other indirect emissions that occur in a company s value chain. Examples: Purchased goods and services, business travel, and employee commuting and schematic below shows the three scopes across a typical company s value Footprinting : An Investor Toolkit4 Figure 2 Greenhouse Gas Protocol Scopes and EmissionsSource: Greenhouse Gas ActivitiesReporting CompanyDownstream ActivitesScope 3 (Indirect)Transportation and DistributionProcessing of Sold ProductsUse of Sold ProductsEnd-of-Life Treatment of Sold ProductsLeased AssetsFranchisesInvestmentsScope 2 (Indirect)Purchased Electricity, Steam, Heating and Cooling For Own UseScope 3 (Indirect)Purchased Goods and ServicesCapital GoodsFuel and Energy-Related ActivitiesTransportation and DistributionWaste Generated in OperationsBusiness TravelEmployee CommutingLeased AssetsScope 1 (Direct)Company FacilitiesCompany VehiclesCarbon FootprintScope 3 ComplexitiesTake a US steel company with Global operations and a long value chain.
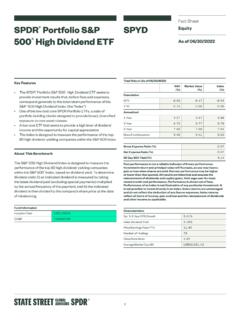
6 How should we measure this company s Carbon footprint? In an ideal world, we would simply add up a company s scope 1, 2 and 3 emissions and divide by the company s revenue (in $million). In reality, it s not so scope 3 emissions is an inexact science with limited data and varying methodologies generating sometimes widely varying results. While reporting on Scope 1 and 2 emissions is becoming the norm in most jurisdictions, reporting on scope 3 emissions is largely categorisation of companies can help to reveal the true sources of emissions. The chart below illustrates transition risk for various sectors, split by the scope of emissions in those sectors. It s clear that the impact of the uncertainties around measuring scope 3 emissions is greatest in the energy Footprinting : An Investor Toolkit5 Another problem is double counting of emissions.
7 One company s scope 3 emissions can overlap with another s scope 1 emissions. Categories can also be double counted within Scope 3, for example, if two companies account for third-party transportation of goods between scale of the problem is compounded because scope 3 emissions can constitute the largest portion of companies Carbon footprint. It has been estimated that on average, more than 75% of an industry sector s Carbon footprint is attributed to Scope 3 Yet, a focus on scope 3 emissions has been criticised for drowning valuable information on scopes 1 and 2 emissions in a sea of of these challenges, the TCFD currently recommends calculating Carbon intensity using scope 1 and 2 emissions and, if appropriate, scope 3 GHG emissions.
8 The new European Union climate benchmark regulations encourage the use of Scope 3 emissions, based on the Technical Expert Group s (TEG s) is the TEG s guidance on when companies should account for their scope 3 GHG emissions by 3 Transition Risk: Sector Breakdown emissionsof Scope 1+2 and Scope 3 Source: Trucost. Chart is provided for illustrative StaplesHealth CareInformation TechnologyCommunicationServicesConsumer DiscretionaryEnergyMaterialsUtilitiesRea l EstateFinancialsScope 1+2 Scope 303,0002,5002,0001,5001,000500 Source: European Commission Technical Expert Group on Sustainable Finance (2020).Accounting for Scope 3 GHG EmissionsFigure 4 TEG Guidance on Scope 3 Emissions ReportingAfter 4 yearsEvery sectorAfter 2 yearsAt least transportation, building, materials and industrial activitiesAt the date of implementationAt least energy (oil & gas) and miningCarbon Footprinting : An Investor Toolkit6 The TCFD recommends calculating Carbon intensity using scope 1 and 2 emissions and, if appropriate, scope 3 GHG emissions.
9 Given the current State of corporate Scope 3 GHG reporting, the TEG recognises that Scope 3 data will likely be effectiveness and efficiency of reduction targets will largely depend on how firms will substantially increase the volume and quality of its Scope 3 GHG emissions reporting or the quality of the Scope 3 estimations. We can expect the Scope 3 phase-in to help improve the quality and reliability of data (in particular for oil & gas and mining).The list of high-impact sectors should be reviewed once scope 3 emissions are implemented for every sector. The financial sector for example, considered as low impact by the TEG, has a very limited impact when considering scope 1 & 2 emissions but has relatively significant scope 3 emissions, notably through the financing of Carbon -intensive projects and 3 emissions are also more important for companies in the services industries (7% 30% of emissions) where employee commuting and air transportation are common, compared to companies in the manufacturing industries (<1% of total analysed emissions).
10 7As progress is made to more accurately account for scope 3 emissions, a nuanced and prudent approach is advised. Key for investors is to ensure companies are clearly reporting their Carbon emissions and the data and assumptions used in their calculations. If companies are reporting scope 1 and 2 emissions only, they should be able to explain why they have excluded their scope 3 footprint. Companies that do not disclose such information and cannot adequately explain it should be a red is a summary of the key characteristics of scope 1, 2 and 3 5 Overview of Scope 1, 2 and 3 GHG Protocol Characteristics Scope 1 + 2 GHG ProtocolDirect + First Tier Indirect S&P Trucost GHG Protocol + 4 GasesScope 1 + 2 + 3 GHG Protocol Data Robustness and ReliabilityMost robust and reliable Most commonly reportedGood Least robust and reliableChallenges to measuring scope 3 Significant estimationsComprehensiveness of Emissions MeasureLeastModerateMost comprehensive (Food companies/Oil & Gas)