Transcription of Carbon intensity of blue hydrogen r1
1 Carbon intensity of blue hydrogen productionAccounting for technology and upstream emissions Jan Gorski, Tahra Jutt, Karen Tam Wu | August 2021 (revised)photo: Roberta Franchuk, Pembina InstituteTECHNICAL PAPER Carbon intensity of blue hydrogen production Accounting for technology and upstream emissions by Jan Gorski, Tahra Jutt, Karen Tam Wu | August 2021 (revised) Introduction As Canada considers pathways to net-zero emissions by 2050, blue hydrogen hydrogen gas derived from natural gas with Carbon capture , utilization and storage (CCUS) is receiving significant interest as an energy carrier. There are many competing claims about the climate benefits of blue hydrogen .
2 This is partly because differences in production methods, technology choices, gas supply, energy requirements, and Carbon capture rates lead to different estimates of emissions. As well, because blue hydrogen is created from fossil fuels, the emissions associated with the production and transportation of the fossil fuel source must also be included in its emissions profile. In this paper we examine the emissions associated with blue hydrogen over the full life cycle, and the potential contribution and limits of CCUS technologies to decrease production emissions. Blue hydrogen production The main technology that has traditionally been used to produce blue hydrogen is steam methane reforming.
3 However, companies are now pursuing autothermal reforming as a more cost-effective means to mass produce hydrogen . Both these processes separate hydrogen from the natural gas (methane) to produce syngas that can be further separated into hydrogen and Carbon dioxide. Steam methane reforming (SMR) uses steam to separate the hydrogen from natural Most SMR facilities in current operation produce hydrogen for use as a feedstock to other processes such as oil refining, fertilizer, or chemical production. 1 Global Syngas Technologies Council, Steam-Methane Reforming. Pembina Institute Carbon intensity of blue hydrogen production | 2 Auto-thermal reforming (ATR) is a commercial technology commonly used in the production of ammonia and ATR is now being proposed as a preferred technology to produce pure hydrogen from natural gas because it allows capture of Carbon at higher rates than conventional SMR, at lower Compared to SMR, ATR has a simpler production stream, with a high concentration of Carbon dioxide.
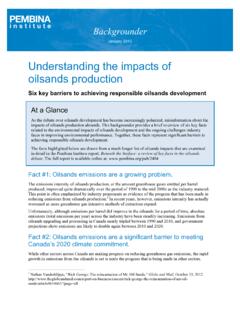
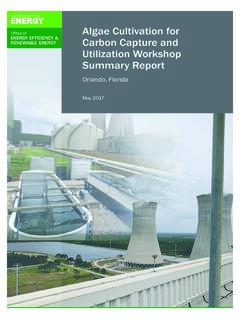
4 This makes it easier to capture a higher percentage of Carbon emissions in the conversion With blue hydrogen , the amount of Carbon captured and stored from the production process is a key factor in the Carbon intensity of the hydrogen produced. CCUS is discussed in greater detail below. Life cycle GHG emissions of blue hydrogen Figure 1. Blue hydrogen production process An accurate estimate of the Carbon footprint associated with hydrogen production from natural gas requires accounting for the various sources of emissions from well to point of use. The full life cycle emissions include all the emissions from all energy expended from: the construction and decommissioning of facilities for hydrogen production and Carbon capture (negligible for blue hydrogen ) the extraction and transportation of natural gas (upstream emissions) the hydrogen production process ( SMR or ATR) 2 Global Syngas Technologies Council, Auto-Thermal Reforming.
5 3 hydrogen Council, Path to hydrogen competitiveness: A cost perspective (2020), 21. 4 S. Assabumrungrat and N. Laosiripojana, Fuels hydrogen Production: Autothermal Reforming, Encyclopedia of Electrochemical Power Sources (Elsevier Science, 2009). NATURAL GASEXTRACTION AND TRANSPORTHYDROGEN PRODUCTION(SMR or ATR)CH4 Carbon TRANSPORTAND STORAGEHYDROGEN TRANSPORTH2CO2CO2CO2 ELECTRICITYCARBONCAPTURECO2 Pembina Institute Carbon intensity of blue hydrogen production | 3 the Carbon capture process including capture , transport, and storage Upstream emissions Emissions associated with producing, processing, and transporting natural gas known as upstream emissions are also a significant contributor to the Carbon intensity of blue hydrogen production.
6 The source of these emissions is methane vented or leaked during production, processing, and transport, and fuel burned to power engines, compressors, boilers, and heaters. These emissions vary based on the composition of gas found in different natural gas reservoirs, the amount of gas processing required, the ratio of natural gas to electric power used in the process and transport of gas, and the Carbon intensity of the electricity that is used. They can also vary significantly depending on the amount of methane leaked and vented in the process and the stringency of regulations at a regional level that prevent methane emissions.
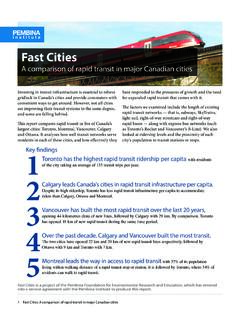
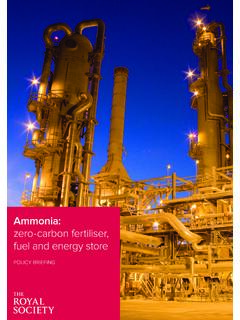
7 hydrogen production process and Carbon capture rates Both SMR and ATR produce similar levels of Carbon emissions during the chemical reactions that separate the hydrogen from the methane molecule in both processes. However, with SMR, typically only about 60% of the Carbon is contained in the process gas stream; the remaining 40% is in the flue gas (exhaust gas) where it is less SMR plants in operation today do not capture Carbon from this flue gas stream. The Carbon intensity of hydrogen produced from existing facilities is sometimes reported as the percent of the process Carbon that is captured, rather than a percentage of the total Carbon emissions from the hydrogen plant (see Figure 2, below).
8 Carbon capture rates of 90% have been demonstrated but have not yet been applied to the production of hydrogen by This is because existing blue hydrogen production is integrated into refineries and ammonia plants facilities where the end product is not hydrogen . As a result, the design of the plant is specific to the application. These existing integrated hydrogen plants were retrofitted to capture Carbon and are not representative of what can be achieved at new hydrogen production plants designed to produce hydrogen as a commercial fuel. The Polaris project proposed by Shell aims to capture more than 90% of the CO2 emissions related to hydrogen production in the Scotford refinery hydrogen 5 Path to hydrogen competitiveness, 21.
9 6 90% was demonstrated at the Petra Nova coal powered electricity plant demonstration project in Texas. NRG Energy, Petra Nova: Carbon capture and the future of coal power. 7 Shell, Shell proposes large-scale CCS facility in Alberta, news release, July 13, 2021. Pembina Institute Carbon intensity of blue hydrogen production | 4 Conversely, Carbon emissions associated with ATR process are nearly entirely contained within the process gas stream and are at a higher concentration. ATR plants can therefore more easily achieve higher capture rates at a lower cost compared to SMR at full scale Two currently proposed ATR plants both have target capture rates of 95%.
10 If an SMR facility with CCUS captures 80% of its Carbon process stream but only about 60% of Carbon is emitted in the process stream it captures only 48% of the total Carbon produced (see Figure 2). Carbon capture process The energy required to operate the Carbon capture plant can be a significant source of emissions depending on its source. An ATR plant with Carbon capture typically requires more electricity than an SMR plant. Using low- Carbon electricity can reduce the emissions associated with the energy penalty. Figure 2. Carbon capture opportunities in hydrogen production In an SMR facility (top), typically only around 60% of total Carbon emissions from the facility are from the process stream; the remainder are in the flue gas and may not be captured.