Transcription of Cargo Chartbook Q1 2018 - iata.org
1 Cargo Chartbook Q1 2018 1 Cargo Chartbook Q1 2018 Solid backdrop for air Cargo demand and financial performance Air freight tonne kilometres (FTKs) grew by year-on-year in the three months ended January a robust pace by historical standards. That said, the quarterly seasonally adjusted (SA) pace of volume growth slowed once again. Demand for air freight has been boosted since mid-2016 by the stronger economic and trade backdrop, bottlenecks in manufacturing supply chains, and a broader inventory restocking cycle. Recent protectionist measures pose risks to global trade, but business surveys still point to solid annual FTK growth of around in Q2 2018 . Favorable supply and demand dynamics have continued to drive Cargo yields upwards, and to offset some pressure from rising fuel costs.
2 Meanwhile, daily freighter utilization rates have also continued to trend upwards into 2018 . Market developments Industry-wide FTKs grew by year-on-year in the three months ended January a solid pace by historical standards but a slowdown from the double-digit annual rates seen in early to mid-2017. Indeed, while FTKs trended upwards in seasonally adjusted (SA) terms into 2018 , the latest quarterly growth rate was the slowest in almost two years. Annual growth in FTKs slowed on all of the major international market segments in Q4 2017, but remained solid in the region of 5-10% year-on-year. Market drivers The upturn in air freight demand in recent years has been supported by the stronger trade and economic backdrop, increasing bottlenecks in manufacturing supply chains, and a broader inventory restocking cycle.
3 We expect economic momentum, particularly buoyant consumer confidence, to continue to support air freight demand in the near term. The recent pick-up in protectionist trade measures poses obvious downside risks to global trade. Nonetheless, business surveys are consistent with solid annual FTK growth of around in Q2 2018 . Capacity, costs and yields 292 tonnes of additional Cargo payload have been added to the freighter fleet so far in 2018 (gross). However, more than four times as much has been added in the form of belly-capacity via deliveries to the wide-body passenger fleet. More favorable supply and demand dynamics have continued to drive Cargo yields higher: yields rose by year-on-year in Jan.
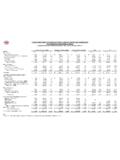
4 This is helping to offset upward pressure on breakeven loads from higher fuel prices. Daily utilization rates of large freighter aircraft trended upwards into 2018 , and remain at their highest level in more than five years. Increased utilization will help to further reduce unit costs, and to reinforce Cargo airline financial performance. Heads of Cargo remain upbeat When surveyed in early-January, nearly two-thirds of airline Heads of Cargo expected freight volumes to increase over the year ahead. Our survey respondents also continued to expect further gains in yields over the period. (See Chart 1.) Chart 1 iata survey of heads of Cargo Table 1 Key data overview David Oxley 12th March 2018 0102030405060708090100 Jan 2008 Jul 2008 Jan 2009 Jul 2009 Jan 2010 Jul 2010 Jan 2011 Jul 2011 Jan 2012 Jul 2012 Jan 2013 Jul 2013 Jan 2014 Jul 2014 Jan 2015 Jul 2015 Jan 2016 Jul 2016 Jan 2017 Jul 2017 Jan 2018 *Quarterly dataSource.
5 iata EconomicsWeighted score (50 = no change) Cargo volumes -next 12 monthsCargo yields -next 12 monthsKey data overview - rolling 3 month 292 1,203 1,495 ended Jan 20182 3m ended Dec 20173 Average of 3m ended Feb 2018 Rolling 3 month periods (unless specified otherwise)% quarter-on-quarter% year-on-yearIndustry-wide FTKs1 North America-Asia2 Asia-Europe2 Europe-North America2 Within Asia (int'l)2 World trade volumes2 Global PMI new export ordersYear-on-year changeAdditional widebody payload capacity ( 2018 , up to 7 March)Industry-wide Freight Tonnes2 Cargo Chartbook Q1 2018 2 Market developments 1. Air freight tonne kilometres (FTKs) have continued to trend upwards in seasonally adjusted (SA) terms into 2018 , albeit at a slower pace than seen during the best of the upturn in freight volumes in recent years.
6 2. Indeed, while FTKs grew by a robust year-on-year in the three months ended January, around half of this increase reflects gains seen during the middle of 2017. Freight volumes rose at an annualized rate of last quarter. 3. Every region made a positive contribution to year-on-year FTK growth in the three months ended January. Middle Eastern carriers posted the slowest annual growth rate for just the second time since 1999. 4. Air freight has outperformed wider goods trade since the start of 2016, consistent with the typical pattern seen during economic upturns. However, the upward trend in air freight volumes has lagged behind world trade in the past 6 months. 5. The major international market segments posted solid year-on-year FTK growth in Q4 2017, albeit slower than earlier in the year.
7 Three of the four major routes saw volumes fall in SA quarter-on-quarter terms in Q4. 6. There has continued to be a wide range in Cargo throughput performance at an airport level. Singapore posted the fastest growth in January ( ), but growth was slower in Miami and Frankfurt; Dubai saw a year-on-year decline. 44464850525456586062 Jan'12 Apr'12 Jul'12 Oct'12 Jan'13 Apr'13 Jul'13 Oct'13 Jan'14 Apr'14 Jul'14 Oct'14 Jan'15 Apr'15 Jul'15 Oct'15 Jan'16 Apr'16 Jul'16 Oct'16 Jan'17 Apr'17 Jul'17 Oct'17 Jan'18*Rolling 3 month periodsSources: iata Economics, iata Monthly StatisticsIndustry-wide FTKs (billions per rolling 3m period)ActualSeasonally adjusted-4%-2%0%2%4%6%8%10%12%Jan'12 Apr'12 Jul'12 Oct'12 Jan'13 Apr'13 Jul'13 Oct'13 Jan'14 Apr'14 Jul'14 Oct'14 Jan'15 Apr'15 Jul'15 Oct'15 Jan'16 Apr'16 Jul'16 Oct'16 Jan'17 Apr'17 Jul'17 Oct'17 Jan'18*Rolling 3 month periodsSources.
8 iata Economics, iata Monthly StatisticsIndustry-wideFTKs (% growthrate)Quarter-on-quarterYear-on-yea r-6%-4%-2%0%2%4%6%8%10%12%Jan'12 Apr'12 Jul'12 Oct'12 Jan'13 Apr'13 Jul'13 Oct'13 Jan'14 Apr'14 Jul'14 Oct'14 Jan'15 Apr'15 Jul'15 Oct'15 Jan'16 Apr'16 Jul'16 Oct'16 Jan'17 Apr'17 Jul'17 Oct'17 Jan'18 AfricaLatin AmericaMiddle EastNorth AmericaEuropeAsia PacificIndustry totalSources: iata Economics, iata Monthly StatisticsContributions to industry FTK growth (percentage points, by region of registration)*Rolling 3 month periods909510010511020002001200220032004 2005200620072008200920102011201220132014 201520162017*Rolling 3 month periodsSources: iata Economics, iata Monthly StatisticsRatio of industry FTKs to world trade volumesIncreasing FTK share60708090100110120130140 Indices (SA, 3m ended Jan 2012 =100)Global FTKsWorld trade volumes34567891011 Sep'12 Mar'13 Sep'13 Mar'14 Sep'14 Mar'15 Sep'15 Mar'16 Sep'16 Mar'17 Sep'17 Sources.
9 iata Economics, iata Monthly Statistics routeInt'l FTK by route (segment-basis, billion)Europe-AsiaAsia -North AmericaEurope -North AmericaWithin Asia-15%-10%-5%0%5%10%15%20%Sep'12 Mar'13 Sep'13 Mar'14 Sep'14 Mar'15 Sep'15 Mar'16 Sep'16 Mar'17 Sep'17*Rolling 3 month periods(% year-on-year)US west coast seaport (DXB)Frankfurt (FRA)Miami (MIA)Tokyo (NRT)Los Angeles (LAX)Shanghai (PVG)*Hong Kong (HKG)Singapore (SIN)Source:Individual airport websitesTonnesof Cargo throughput (% year-on-year, Jan 2018 unless specified)*Jan and Feb combined to help adjust for Chinese New Year Cargo Chartbook Q1 2018 3 Market drivers 7. Global business confidence has continued to trend upwards in recent months, and is currently at its highest level since August 2014.
10 Economic activity in the so-called emerging markets improved strongly in late-2017. 8. Consumer confidence remains buoyant, and is helping to support demand for air freighted goods. This has particularly been the case in major emerging markets, which ties in with reports of more balanced Cargo flows on key trade lanes. 9. The pick-up in air freight demand in recent years has coincided with a stronger global economic and trade backdrop: global goods trade grew by year-on-year in Q4 2017 well above its five-year average pace ( ). 10. Air freight demand has also been boosted by the restocking cycle. We estimate that the restocking cycle explains half of the outperformance of air freight growth relative to wider global goods trade growth in 2017.