Transcription of Catalase Kinetics Chris Su Meiyi Li TR
1 1 Catalase Kinetics Chris Su Meiyi Li TR Kinetic studies on the activity of Catalase conducted using a pressure gauge indicates that the enzyme has a Vmax value of , and Km value of The Catalase appears to be affected by fluctuating pH values, and operates most ideally at pH 9. Temperature studies determined the activation energy of the catalyzed reaction to be kJ/mol, and the reaction rate steadily increases with rising temperature. The combination of a Coomassie Protein Assay and a Ferrozine Assay determined that iron atoms bind to each molecule of Catalase , although this does not agree with the expected 4 iron atoms per Catalase molecule. 2 Introduction Catalase is an important biological enzyme responsible for the conversion of hydrogen peroxide to water and oxygen (Figure 1). Catalase is remarkably efficient, and one Catalase enzyme can convert 40 million molecules of hydrogen peroxide to oxygen and water per second.
2 This enzyme is necessary as a condition for survival, as the Catalase breaks down hydrogen peroxide from accumulating to dangerous levels. Hydrogen peroxide is a strong oxidizer, and high levels in the body will induce cellular damage from oxidative 2H2O2(aq) ----( Catalase )---> 2H2O (l) + O2 (g) Figure 1. The decomposition of hydrogen peroxide to water and oxygen, as catalyzed by Catalase . The enzyme is a tetrameter comprised of subunits of 500 amino acids each, containing a heme (a prosthetic group containing an iron center). This structure is similar to that of the hemoglobin, also an important protein required for This experiment seeks to investigate the Kinetics of Catalase action, as well as factors that influence the rate of catalysis, including pH and the activation energy of the enzyme. Additionally, a protein assay used to determine the concentration of the Catalase as well a ferrozine assay seeks to determine and detect the amount of enzyme-bound iron in Catalase .
3 The specific goals for the experiment are as follows: (1) Investigate the enzyme activity of Catalase through studying the decomposition of hydrogen peroxide to water and oxygen gas. (2) Investigate the enzyme-bound iron content of Catalase by using a modified ferrozine method. (3) Perform a protein assay to determine the enzyme concentration of a given sample. (4) Study the effects of reaction environment (temperature, pH) on the rate of the enzyme-catalyzed reaction. Enzyme Kinetics is governed by a series of equations. First, for a typical reaction aA + bB cC + dD, the rate reaction is given by: rate = k [A]x [B]y. In this equation, the k is the rate constant, and x and y indicates the order of the reaction in respect to each reactant. The variables x and y are different from the coefficients of a and b in the balanced equation. In order to measure the rate of the reaction empirically, one can go about 1 Massachusetts Institute of Technology, Laboratory Manual.
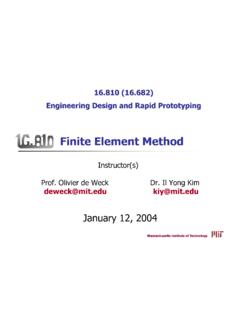
4 2 Boon, Downs, and Marcey. Catalase : H2O2 Oxdioreductase, Boon, Downs, and Marcey. Catalase : H2O2 Oxdioreductase, #Topic2. 3 measuring the changes in pressure inside the reaction vessel over time. From approximating ideal conditions and using the PV=nRT equation, one can obtain the rate of the reaction being 1/RT d[P] Another important equation in enzyme Kinetics is the Michaelis-Menten mechanism. The mechanism is summarized using the following schematic: (Figure 2) k1 k2 E + S -------> ES -------> E + P <------- <------- k-1 k-2 Figure 2. The Michaelis-Menton mechanism, with E and S standing for the enzyme and the substrate, respectively.
5 ES is the intermediate complex, and P is the product of the reaction. The Michaelis-Menton mechanism rests on three important assumptions. First, k-2 = 0, so the product will not revert back to the substrate. Second, the reaction proceeds at steady state (the concentration of the enzyme substrate complex (ES) is constant, and the concentration of the enzyme (E) is constant). Finally, the total amount of the enzyme is constant ([E]total = [E] + [ES]). Through extended derivation of the original equation and these three assumptions, one may arrive at the Michaelis-Menton equation, which is presented in Figure 3. rate = !!"# [!]!!![!] Figure 3. The Michaelis-Menton equation demonstrating the relationship between reaction rate and the substrate concentration. Vmax indicates the maximum rate of the reaction, while Km is the concentration of the substrate when the initial rate is one half of its maximum rate.
6 The rate calculated by this reaction is the initial rate of the reaction. Taking the reciprocal of the Michaelis-Menton equation, one attains the Lineweaver-Burk plot, which uses graphical methods to obtain both Vmax and Km. The Lineweaver-Burk plot is given by Figure 4. 1!"#$=!!!!"#1[!]+1!!"# Figure 4. The Lineweaver-Burk equation, providing a linear plot when 1/rate and 1/[S] is graphed. 3 Massachusetts Institute of Technology, Laboratory Manual. 4 The linear graph of 1/rate vs. 1/[S] in the Lineweaver-Burk plot provides several useful values. The slope of the line is Km/Vmax, the y-intercept is 1/Vmax, and the x-intercept is -1/Km. Therefore, the Lineweaver-Burk plot provides easy access to the determinatino of these values in a kinetic measurement.
7 Finally, another important value in the study of enzyme Kinetics is the value of Ea, or the activation energy of the reaction. The activation energy is the energy bump that is needed to be overcome to help a reaction get started and proceed from reactants to products without any other added energy. The catalyst helps promote the reaction by lowering the activation energy barrier. The relationship of the activation energy and the reaction rate is summarized by the Arrhenius equation (Figure 5). !=! !!!!!" Figure 5. The Arrhenius equation, with Ea being the activation energy, given in kJ/mole, the R being the universal gas constant J/K mol, the T being the absolute temperature in Kelvins, and A being the collision frequency factor. Just like how the Lineweaver-Burk plot is a more useful depiction of the Michaelis-Menton equation, the ln k vs. 1/T plot can also be used to linearlize the relation and provide useful data.
8 The ln k vs. 1/T plot for the activation energy is given in Figure 6. ln!= !!! 1! +ln! Figure 6. The ln k vs. 1/T plot that linearizes the Arrhenius equation. This plot is especially useful because the slope of the resulting line is Ea/R. Two major laboratory techniques are introduced in this laborary experiment, including the measurement of rate and calorimetry experiments using a UV-Vis spectrometer. For the rate determination experiments, the reactants ( Catalase and hydrogen peroxide) are added to a sealed glass tube with a pressure sensor attached. During the reaction progress, the pressure inside the vessel is carefully monitored. Combined with the volume of the vessel and the reaction temperature, the oxygen pressure in the vessel can be converted back to the concentration of the oxygen in the vessel using the ideal gas equation. This information then yields the rate of the decomposition of hydrogen peroxide by Catalase .
9 Using this strategy, rate measurements are taken under three separate conditions (1) varying the amount of hydrogen peroxide present in the vessel, (2) varying the pH of the phosphate buffer, and (3) varying the temperature of the reaction. These trials allow the experimenter to determine the Km, Vmax, Ea, and A of the kinetic reaction, as well as the optimal pH of Catalase action. The second half of the experiment relies on calorimetric analysis to determine the concentration of the enzyme present in an unknown sample of Catalase , as well as the concentration of enzyme-bound iron in Catalase . 5 Calorimetric analysis utilizes a UV-VIS spectrometer, and relies on two important observations in the two experiments. When the protein in the unknown sample of Catalase binds to the Coomassie dye in the first assay, the absorbance of the dye shifts from 465 nm to 595 nm. In the second assay, when the ferrozine present forms a complex with ferrous iron, the complex absorbs at 562 nm.
10 By exploiting these observations and measuring for absorbance at 595 nm and 562 nm, respectively, the researcher may determine the concentration of the protein in the first assay and the concentration of the enzyme-bound iron in the second assay. Procedure A sealed glass pressure tube that is connected to a pressure sensor was created and submerged in a water bath with an inserted thermometer. A stir bar was added to the pressure tube to ensure even stirring for every trial of the experiment. The pressure measurements were collected by the Logger Pro data-monitoring program. To determine the Km and the Vmax of the kinetic reaction, six trial runs were run, which varies the concentration of the hydrogen peroxide while keeping the concentration of the Catalase constant. The reaction conditions are summarized in Table 1, found in the Results section. The temperature of the water bath and the surrounding atmosphere was kept constant for these trials.