Transcription of Causes and Consequences of Polarization
1 Task Force on Negotiating Agreement in Politics 19 Rarely these days does a news cycle pass without new stories of political dysfunction in Washington, DC. New reports of stalemates, fiscal cliffs, and failed grand bargains have begun to erode the public confidence in the ability of our representative institutions to govern effectively. In May 2013, only one American in six approved of the way Congress has handled its Sad ly, that level of support was a major improvement from the previous summer, when wrangling over the usually routine matter of raising the debt ceiling drove congressional approval down to 10%. The most common diagnoses of Washington s ailments center on the emergence of excessive partisanship and deep ideological divisions among political elites and officeholders. In short, Polarization is to blame. Consequently, the reform-minded have taken up the mantle of reducing Polarization or mitigating its effects.
2 In recent years, proposals for electoral reform to change electoral districting, primary elections, and campaign finance have been presented as panaceas. Other reformers have focused on changing legislative procedures such as those related to the filibuster, appropriations, and confirmation process to limit the opportunities for Polarization to undermine there has been intense public discussion about the Causes of Polarization , its Consequences , and possible cures, social science research has only recently begun to help shape those discussions. The intent of this chapter is to provide a more evidence-based foundation for these debates. PreliminariesThe academic study on partisanship and Polarization is based on a combination of qualitative and quantitative research. Noteworthy qualitative accounts, which often combine historical research and participant observation, include Rohde (1991), Sinclair (2006), Hacker and Pierson (2006), and Mann and Ornstein (2012).
3 The starting point for many quantitative studies of Polarization is the robust observation of rising partisan differences in roll-call voting behavior in Congress. The bipartisan coalitions of the 1950s and 1960s have given way to the party-line voting of the twenty-first century. Although 1 Causes and Consequences of Polarization *Michael Barber and Nolan McCarty* This piece was shaped profoundly by discussions of the American Working Group of the APSA Task Force on Negotiating Agreement in Politics. This group includes Andrea Campbell, Thomas Edsall, Morris Fiorina, Geoffrey Layman, James Leach, Frances Lee, Thomas Mann, Michael Minta, Eric Schickler, and Sophia Wallace. We also thank Chase Foster for his assistance with the Working American Political Science Associationthese trends are apparent in simple descriptive statistics about partisan divisions on roll calls, political scientists have developed more refined measures of partisan voting differences.
4 A variety of techniques uses data on roll-call voting to estimate the positions of individual legislators on a set of The primary scale the one that explains most of the variation in legislator voting generally captures partisan conflict. At the individual-legislator level, positions on these scales reflect a mix of ideological positioning and constituency interest as well as party loyalty and discipline. Political scientists continue to debate the exact weights of these factors. Some scholars argue that the scores primarily capture ideological differences ( , Poole 2007), whereas others interpret them as measures of partisanship ( , Lee 2009). Without taking a position on this debate, we refer to the primary roll-voting scale as the party-conflict dimension. 3 However, consistent with common usage, we may also label positions on the scale as liberal, moderate, or of these techniques for estimating the party-conflict dimension produce similar findings with respect to Polarization .
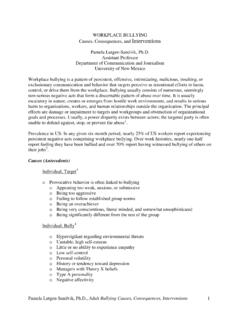
5 Consequently, we focus on the DW-NOMINATE measures developed by McCarty, Poole, and Rosenthal (1997). Generally, these scores range from -1 to +1 and are scaled so that the highest scores are those of conservative Republicans and the lowest are those of liberal the estimated positions of legislators on this scale, we can measure partisan Polarization by computing the difference in means (or medians) across the political parties, where a larger gap indicates a greater level of Polarization . Figure presents the difference in party means on the party-conflict scale from 1879 through the 1930s until the mid-1970s, these measures of Polarization were quite low. Not only were differences between the typical Democratic and Republican legislators small, but there 2 See Poole and Rosenthal (1997); Groseclose, Levitt, and Snyder (1999); Clinton, Jackman, and Rivers (2004).3 It is important, however, to distinguish these scores from party loyalty.
6 Some members who have extreme positions on these scales are not always loyal partisans ( , Tea Party Republicans).. in HousePolarization in SenateAverage Difference on Party Conflict ScaleFigure 1: Polarization in CongressFigure : Average Distance between Positions across Parties. The y-axis shows the difference in mean positions between the two parties in both the House of Representatives and Senate from 1879 to 2011 using the DW-NOMINATE measures. Congress is more polarized than it has been in over 125 years. Task Force on Negotiating Agreement in Politics 21also were significant numbers of conservative Democrats and liberal Republicans. Since the 1970s, however, there has been a steady and steep increase in the Polarization of both the House and Senate. Other measures of party conflict confirm the trend of increasing Polarization in the past 40 Although conventional wisdom often asserts that Polarization resulted from the changing behavior of both parties ( , with Democrats moving to the left and Republicans to the right), the evidence shows that the behavioral changes are far from symmetric and are largely driven by changes in the positioning of the Republican Figure plots the average positions of the parties by region.
7 In the past 40 years, the most discernible trend has been the marked movement of the Republican Party to the right (for qualitative evidence, see Hacker and Pierson 2006; Mann and Ornstein 2012). It is important to note that the changes in the Republican Party have affected both its Southern and non-Southern members. The movement of the Democratic Party to the left on economic issues in the past 50 years is confined to its Southern members reflecting the increased influence of African American voters in the South. However, it is important that the implied asymmetry may pertain only to the issues (primarily economic) that dominate the congressional agenda. It may well be the case that on some social issues ( , gay marriage), Polarization is the result of Democrats moving to the left. 4 Although Figure shows a steady movement by the average Republican, the Republican caucus in Congress has not become more homogeneous in the same time period.
8 The standard deviation of Republican ideal points has remained around since the 1950s. Democrats, conversely, have become much more homogeneous in the same period with the disappearance of conservative southern For a discussion of methodological issues underlying this claim, see Hare, McCarty, Poole, and Rosenthal : Mean Party-Conflict Score by Party and Region. The y-axis shows the mean position of each party by region. In this plot, the South is defined as AL, AR, FL, GA, KY, LA, MS, NC, OK, SC, TN, TX, and VA. There were no Southern Republican Senators between 1913 and 1960 and only two before American Political Science AssociationAnother important aspect of the increase in party Polarization is the pronounced reduction in the dimensionality of political conflict. Many issues that were once distinct from the party-conflict dimension have been absorbed into it. Poole and Rosenthal (1997) and McCarty, Poole, and Rosenthal (1997) both noted that congressional voting can be increasingly accounted for by a single dimension that distinguishes the parties.
9 This situation directly contrasts with that of the mid-twentieth century, when the parties divided internally on a variety of issues primarily related to race and region. Figure quantifies these changes, showing the percentage of individual roll-call vote decisions in the House that can be correctly classified by one- and two-dimensional The two-dimensional spatial model accounts for most individual voting decisions since the late nineteenth century. Classification success was highest at the turn of the twentieth century, exceeding 90 percent. However, the predictive success of the two-dimensional model fell during most of the twentieth century, only to rebound to the 90% level in recent Increasingly, most of the work is being done by the party-conflict dimension. In the period from 1940 to 1960, adding a second dimension to account for intraparty divisions on race and civil rights led to a substantial improvement to fit.
10 A second dimension often explained an additional 3% to 6% of the voting decisions in the House. However, in recent years, the second dimension adds no additional explanatory value. In the 112th Congress, the second dimension explains only an additional 1,800 votes of the almost 600,000 cast by House Polarization and the reduction in dimensionality tend to coincide, there is no necessary logical connection between the two trends. One possibility is that partisan Polarization 6 When legislators cast a vote in the way that is predicted by their estimated position on the scales, we say their vote is correctly classified. Therefore, the figure simply plots the total number of correctly classified votes divided by the total number of votes in a given congressional session. Patterns for the Senate are The high rates of classification success that we observe do not result simply because most votes in Congress are lopsided votes, where members say Hurrah.