Transcription of CDC Growth Charts: United States - Calculator
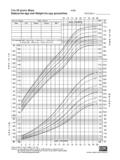
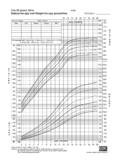
1 234567891011121314151617181920 Age (years)50th25th10th5th75th90th95th85thkg /m 121416182022242628303234kg/m 121416182022242628303234 BMIBMICDC Growth Charts: United StatesSOURCE: Developed by the National Center for Health Statistics in collaboration withthe National Center for Chronic Disease Prevention and Health Promotion (2000).Published May 30, 2000.