Transcription of Census 2011 Municipal report KwaZulu-Natal
1 Census 2011 Municipal report KwaZulu-Natal Statistics South Africa Pali Lehohla report No. 03-01-53 Statistician-General Statistics South Africa Census 2011 Municipal report KwaZulu-Natal / Statistics South Africa Published by Statistics South Africa, Private Bag X44, Pretoria 0001. Statistics South Africa, 2012. Users may apply or process this data, provided Statistics South Africa (Stats SA) is acknowledged as the original source of the data; that it is specified that the application and/or analysis is the result of the user's independent processing of the data; and that neither the basic data nor any reprocessed version or application thereof may be sold or offered for sale in any form whatsoever without prior permission from Stats SA. Stats SA Library Cataloguing-in-Publication (CIP) Data Census 2011 Municipal report KwaZulu-Natal / Statistics South Africa. Pretoria: Statistics South Africa, 2012. report no.: 03-01-53. 195 pp ISBN 978-0-621-41463-9.
2 A complete set of Stats SA publications is available at Stats SA Library and the following libraries: National Library of South Africa, Pretoria Division National Library of South Africa, Cape Town Division Library of Parliament, Cape Town Bloemfontein Public Library natal Society Library, Pietermaritzburg Johannesburg Public Library Eastern Cape Library Services, King William's Town Central Regional Library, Polokwane Central Reference Library, Nelspruit Central Reference Collection, Kimberley Central Reference Library, Mmabatho This report is available on the Stats SA website: For technical enquiries please contact: For dissemination enquiries contact Printing and Distribution, Statistics South Africa Diego Iturralde Ina du Plessis Tel: 012 310 8922 Email: Fax: 086 670 9723. Email: i Statistics South Africa Table of contents Introduction ..1. 5. KwaZulu-Natal ..2. Demographics ..2. Age-sex structure of the province ..2. Population growth rates.
3 14. Sex ratios ..15. Population group ..16. Population by functional age group ..18. Dependency Marital status ..21. Education ..23. Highest level of education attained ..23. School attendance ..25. Labour Unemployment rate ..26. Average household size ..27. Type of main dwelling ..28. Tenure Household Electricity for lighting, cooking and heating ..34. Access to piped water ..36. Refuse disposal ..38. ii Statistics South Africa Toilet facilities ..40. Average household income ..42. Female headed households ..43. Child headed households ..44. Appendix ..45. iii Statistics South Africa List of figures Figure : Distribution of population by age and sex, KwaZulu-Natal - 1996, 2001 and 2011 .. 2. Figure : Distribution of population by age and sex, Ugu District 1996, 2001 and 2011 .. 3. Figure : Distribution of population by age and sex, Umgungundlovu District - 1996, 2001 and 2011 .. 4. Figure : Distribution of population by age and sex, Uthukela District - 1996, 2001 and 5.
4 Figure : Distribution of population by age and sex, Umzinyathi District - 1996, 2001 and 2011 .. 6. Figure : Distribution of population by age and sex, Amajuba District - 1996, 2001 and 7. Figure : Distribution of population by age and sex, Zululand District - 1996, 2001 and 2011 .. 8. Figure : Distribution of population by age and sex, Umkhanyakude District - 1996, 2001 and 2011 .. 9. Figure : Distribution of population by age and sex, Uthungulu District - 1996, 2001 and 2011 .. 10. Figure : Distribution of population by age and sex, iLembe District - 1996, 2001 and 2011 .. 11. Figure : Distribution of population by age and sex, Sisonke District - 1996, 2001 and 2011 .. 12. Figure : Distribution of population by age and sex, eThekwini Metropolitan, - 1996, 2001 and 2011 .. 13. Figure : Population growth rates by district municipality - 1996, 2001 and 2011 .. 14. Figure : Sex ratios by district municipality - 1996, 2001 and 2011 .. 15. Figure (i): Distribution of population by population group and district municipality - 1996, 2001 and 2011 .
5 16. Figure (ii): Distribution of population by population group and district municipality - 1996, 2001 and 17. Figure (i): Distribution of the population by functional age groups and district municipality- 1996, 2001 and 2011 .. 18. iv Statistics South Africa Figure (ii): Distribution of the population by functional age groups and district municipality- 1996, 2001 and 2011 .. 19. Figure : Dependency ratios by district municipality - 1996, 2001 and 20. Figure (i): Distribution of the population by marital status and district municipality - 1996, 2001 and 2011 .. 21. Figure (ii): Distribution of the population by marital status and district municipality - 1996, 2001 and 2011 .. 22. Figure (i): Distribution of the population aged 20 years and older by highest level of education attained and district municipality - 1996, 2001 and 2011 .. 23. Figure (ii): Distribution of the population aged 20 years and older by highest level of education attained and district municipality - 1996, 2001 and 2011 .
6 24. Figure : Distribution of the population aged 5 24 years by school attendance and district municipality - 1996, 2001 and 25. Figure : Unemployment rate (official definition) by district municipality - 1996, 2001, 2011 .. 26. Figure : Average household size by district municipality - 1996, 2001 and 2011 .. 27. Figure (i): Percentage distribution of households by type of main dwelling and district municipality - 1996, 2001 and 2011 .. 28. Figure (ii): Percentage distribution of households by type of main dwelling and district municipality - 1996, 2001 and 2011 .. 29. Figure (i): Distribution of households by tenure status and district municipality - 2001 and 2011 .. 30. Figure (ii): Distribution of households by tenure status and district municipality - 2001 and 2011 .. 31. Figure (i): Distribution of households owning a radio, television, computer, landline/telephone, cell-phone and access to internet by district municipality - 2001 and 2011 .
7 32. Figure (ii): Distribution of households owning a radio, television, computer, landline/telephone, cell-phone and access to internet by district municipality - 2001 and 2011 .. 33. v Statistics South Africa Figure (i): Distribution of households using electricity for heating, cooking and lighting by district municipality - 1996, 2001 and 2011 .. 34. Figure (ii): Distribution of households using electricity for heating, cooking and lighting by district municipality - 1996, 2001 and 2011 .. 35. Figure (i): Distribution of households having access to piped (tap) water and district municipality - 1996, 2001 and 36. Figure (ii): Distribution of households having access to piped (tap) water and district municipality - 1996, 2001 and 2011 .. 37. Figure (i): Distribution of households by refuse disposal and district municipality - 1996, 2001 and 2011 .. 38. Figure (ii): Distribution of households by refuse disposal and district municipality - 1996, 2001 and 2011 .
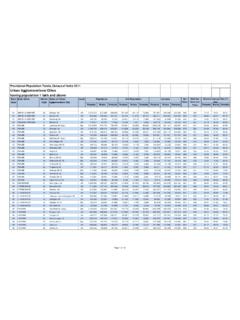
8 39. Figure (i): Distribution of households by type of toilet facility and district municipality - 1996, 2001 and 2011 .. 40. Figure (ii): Distribution of households by type of toilet facility and district municipality - 1996, 2001 and 2011 .. 41. Figure : Distribution of households by average annual household income and district municipality - 2001 and 2011 .. 42. Figure : Distribution of households headed by females and district municipality - 1996, 2001 and 2011 .. 43. Figure : Distribution of households headed by children under 18 years and district municipality - 1996, 2001 and 2011 .. 44. vi Statistics South Africa List of tables Population by age and sex, DC21: Ugu District .. 45. Table : Distribution of population by age and sex, Vulamehlo Local municipality - 1996, 2001 and 2011 .. 45. Table : Distribution of population by age and sex, Umdoni Local municipality - 1996, 2001 and 2011 .. 46. Table : Distribution of population by age and sex, Umzumbe Local municipality - 1996, 2001 and 2011 .
9 47. Table : Distribution of population by age and sex, UMuziwabantu Local municipality - 1996, 2001 and 2011 .. 48. Table : Distribution of population by age and sex, Ezingoleni Municipality - 1996, 2001 and 2011 .. 49. Table : Distribution of population by age and sex, Hibiscus Coast Local municipality - 1996, 2001 and 2011 .. 50. Age and sex structure, DC22: Umgungundlovu District .. 51. Table : Distribution of population by age and sex, uMshwathi Local municipality - 1996, 2001 and 2011 .. 51. Table : Distribution of population by age and sex, uMngeni Local municipality - 1996, 2001 and 2011 .. 52. Table : Distribution of population by age and sex, Mpofana Local municipality - 1996, 2001 and 2011 .. 53. Table : Distribution of population by age and sex, Impendle Local municipality - 1996, 2001 and 54. Table : Distribution of population by age and sex,The Msunduzi Local municipality - 1996, 2001 and 2011 .. 55. Table : Distribution of population by age and sex, Mkhambathini Local municipality - 1996, 2001 and 2011 .
10 56. Table : Distribution of population by age group and sex, Richmond Local municipality - 1996, 2001 and 2011 .. 57. Age and sex structure, DC23: Uthukela District .. 58. vii Statistics South Africa Table : Distribution of population by age and sex, Emnambithi/Ladysmith Local municipality - 1996, 2001 and 2011 .. 58. Table : Distribution of population by age and sex, Indaka Local municipality - 1996, 2001 and 59. Table : Distribution of population by age and sex, Umtshezi Local municipality - 1996, 2001 and 2011 .. 60. Table : Distribution of population by age and sex, Okhahlamba Local municipality - 1996, 2001 and 2011 .. 61. Table : Distribution of population by age and sex, Imbabazane Local municipality - 1996, 2001 and 2011 .. 62. Age and sex structure, DC24: Umzinyathi District .. 63. Table : Distribution of population by age and sex, Endumeni Local municipality - 1996, 2001 and 2011 .. 63. Table : Distribution of population by age and sex, Nqutu Local municipality - 1996, 2001 and 2011 .