Transcription of Changes in the Age Distribution of Mortality over …
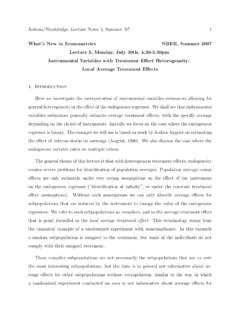
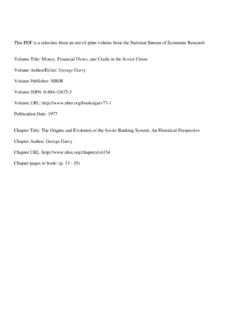
1 This PDF is a selection from a published volume from theNational Bureau of Economic ResearchVolume Title: Perspectives on the Economics of AgingVolume Author/Editor: David A. Wise, editorVolume Publisher: University of Chicago PressVolume ISBN: 0-226-90305-2 Volume URL: Date: May 17-20, 2001 Publication Date: June 2004 Title: Changes in the Age Distribution of Mortality overthe Twentieth CenturyAuthor: David M. Cutler, Ellen MearaURL: rates decline extremely rapidly in the United States over thetwentieth century, as they did in all developed countries. Figure showsthe magnitude of the decline. In 1900, 1 in 42 Americans died annually. Onan age-adjusted basis, the share in 1998 was 1 in 125 people, for a cumula-tive decline of 67 percent.
2 Given such a substantial improvement in mor-tality, it is natural to ask how we achieved such gains in health and whichinnovations or policies contributed most to these a task is clearly large. One way to start is to analyze major trendsin Mortality over the century and to consider how Mortality declines differby age and cause of death. By providing detailed information on which de-mographic groups experienced the largest Mortality improvements and forwhat causes of death, these analyses motivate hypotheses to explain theoverall improvement in Mortality in the twentieth Mortality decline shown in figure seems approximately linearover the time period. Mortality decreased at a relatively constant rate of 1percent per year between 1900 and 1940.
3 There was then a period of rapiddecline from 1940 to 1955 in which Mortality declined 2 percent per year,followed by essentially flat Mortality rates until 1965. Since 1965, mortal-ity rates have fallen at roughly 1 to percent per year. This relative con-stancy of Mortality decline suggests that perhaps a single factor can3339 Changes in the Age Distributionof Mortality over theTwentieth CenturyDavid M. Cutler and Ellen MearaDavid M. Cutler is professor of economics in the Department of Economics and the JohnF. Kennedy School of Government, Harvard University, and a research associate of the Na-tional Bureau of Economic Research. Ellen Meara is assistant professor of health economicsin the Department of Health Care Policy at Harvard Medical School, and a faculty researchfellow of the National Bureau of Economic are grateful to Brian Kim and Mariko Golden for research assistance; to DavidMeltzer, Angus Deaton, Chris Paxson, and Anne Case for comments; and the National In-stitutes on Aging for research cause mortalitySource:United States Vital Statistics :Death rates shown are adjusted to the standard population of the United States in the trend in longer life.
4 The popular Lee and Carter (1992) modelof Mortality posits a driving force of Mortality that is approximately con-stant over the aggregate trends mask as much as they reveal. While mortalitydeclines have been relatively continuous over the twentieth century, the agedistribution of Mortality decline has not. We start offthe paper by high-lighting a basic fact about Mortality declines in the past century: Mortal-ity reduction used to be concentrated at younger ages but is increasinglyconcentrated among the aged. In the first four decades of the century, 80percent of life expectancy improvements resulted from reduced mortalityfor those below age forty-five, with the bulk of this for infants and the next two decades, life expectancy improvements were split relativelyevenly by age.
5 In the latter four decades, about two-thirds of life expec-tancy improvements resulted from Mortality reductions for those over ageforty-five; only one-third was from the younger change has been accompanied by several important epidemiologi-cal trends. Throughout the first half of the twentieth century, infectiousdiseases were the leading cause of death. Changes in the ability to avoidand withstand infection were the prime factors in reduced Mortality in thefirst part of the century. This disease-fighting ability was not predomi-nantly medical. Nutrition (Fogel 1994) and public health measures (Pres-ton 1996) were vastly more important in reduced Mortality over this timeperiod than were medical interventions, as substantial research docu-ments.
6 Nutrition and public health were particularly important for theyoung, and so Mortality reduction was concentrated at younger 1940 and 1960, infectious diseases continue to decline, but wasdue more to medical factors. Antibiotics, including penicillin and sulfadrugs, became important contributors to Mortality reduction in this help the elderly as well as the young, and so Mortality reduc-tions became more widespread across the age 1960, Mortality reductions have been associated with two new fac-tors: the conquest of cardiovascular disease in the elderly, and the preven-tion of infant death due to low birth weight. While it is not entirely clearwhat factors account for the reduction in cardiovascular disease Mortality ,the traditional roles of nutrition, public health, and antibiotics are cer-tainly less important.
7 Taking their place are factors related to individualbehaviors, such as smoking and diet and high-tech medical treatment. Weterm this change the medicalization of death: Increasingly, Mortality re-ductions are attributed to medical care and not social or environmental medicalization of death does not imply that medicine is the only fac-tor influencing Mortality . For several important causes of death, incomeimprovements and social programs have had and continue to have a largeChanges in the Age Distribution of Mortality335impact on Mortality . For example, Medicare likely has a direct impact onmortality by increasing elderly access to medical care, but it also may haveimportant income effects since it reduced out of pocket spending by theelderly for medical care.
8 Social Security and civil rights programs may alsobe important in better health. We do not quantify the role of medicine, in-come, social programs, and other factors in improved Mortality in the lasthalf century, but we show examples where each is important as a first stepin this research paper is structured as follows. The first section presents the basicfacts about Changes in the age Distribution of Mortality change and life ex-pectancy improvements, highlighting the growing role of Mortality reduc-tions among the elderly. The next three sections examine why this trend hasoccurred, discussing in particular the epidemiology of Mortality reductionat different points in time and for different causes.
9 The fifth section thenpresents limited evidence on the nonmedical factors that influence Changes in the Age Distribution of Longer LifeWe start the analysis by summarizing Changes in the age Distribution ofmortality improvements over time. One can summarize Mortality rates inmany ways. We consider a relatively simple measure: life expectancy atbirth [LE0(t)]. This measure has the advantage that it weights mortalitychanges by how important they are to overall survival. Mortality reduc-tions in an age range where few people die will not contribute as much toimprovements in life expectancy at birth as Mortality reductions in an agerange where there are more it is helpful for our analysis, let us be more precise about themeasure.
10 Consider a cohort of people born in year t. At age 0, the share ofpeople who die is p(0, t). Suppose the initial population had S(0, t) number of people alive at the end of year tand entering next year isS(1, t 1) S(0, t) [1 p(0, t)]. To forecast life expectancy, we need toforecast the share of people who will die in year t 1, at age 1, and moregenerally the share of people who will die at age a, in year t a. Followingstandard conventions, we use a period life table and assume that the prob-ability of death at any age ain the future will be equal to the probability ofdeath of people aged a in year t, or p(a, t a) p(a, t). This estimate isstatic; it assumes no change in Mortality in the future.