Transcription of Chapter 1.8 Energy Monitoring and Targeting Part – I ...
1 question bank for Energy Managers & Energy Auditors Chapter Energy Monitoring and Targeting part I: Objective type Questions and answers 1. Energy Monitoring and Targeting is built on the principle of _____ . a) production can be reduced to achieve reduced Energy consumption b) Consumption of Energy is proportional to production rate c) You cannot manage what you do not measure d) None of the above. 2. One of the following is not the element of Energy Monitoring & Targeting system a) Recording the Energy consumption b) comparing the Energy consumption C) Controlling the Energy consumption d) Reducing the production3.
2 Which of the variable does not contribute to Energy consumption? a) Production b) Hours c) Climate d) none of the above4. Poor scattering on trend line of production Vs Energy consumption indicates ___. a) poor level of control b) good level of control c) both the above d) none of above. 5. Level of production may have an effect on specific Energy consumption. State True or False 6. M & T involves a systematic, disciplines division of the facility in to Energy cost centres. State True or False? 7. The empirical relationship used to plot production Vs Energy consumption is (Y= Energy consumed for the period; C = fixed Energy consumption; M = Energy consumption directly related to production; X= production for same period).
3 A) X=Y+MC b) Y=Mx+C c) M=Cx+Y d) None of above 8. The Energy used by any business varies with production process, volumes and input State True or False. 9. 1 kg LPG = _____ kcal. a) 12,000 kcal b) 8000 kCal c) 6000 kCal d) 4000 kCal 10. The Energy used by any manufacturing process varies with a) production volume b) type of process c) resource input d) All the above11. The best way of correlating production and Energy data in any plant a) Text format b) Graphical representation c) Oral communication d) None Energy Monitoring and Targeting -revised (table format) 58 question bank for Energy Managers & Energy Auditors 12.
4 For any company, Energy consumption mostly relates a) Profits b) Inventory c) Production d) All the above 13. What is CUSUM? a) Cumbersome b) Cumulative Sum c) Calculated Sum d) None 14. A CUSUM graph follows a random fluctuation trend and oscillates around. a) 100 b) 100% c) 0 d) none of the above 15. To draw a CUSUM chart following data is required a) Monthly Energy consumption& monthly production b) Monthly specific Energy consumption and turn over c) Monthly profits and production d) None 16. What is specific Energy consumption? a) Energy consumption per month b) Energy consumed per unit of productionc) Energy consumption per year d) none of the above Data required to plot a moving annual total is ____.
5 17. a) production b) Energy c) both the above d) none the above Energy and production data is useful to 18. a) Specific Energy Consumption b) Specific Fuel consumption c) Specific Cost d) None What type of data is useful to find out the fixed Energy consumption? 19. a) SEC Vs production b) SEC Vs Energy c) Production Vs Energy d) None What do you mean by toe 20. a) Total oil equivalent b) Tons of effluent c) Tons of oil equivalent d) none of the above Energy Monitoring and Targeting -revised (table format) 59 question bank for Energy Managers & Energy Auditors part II: Short type Questions and answers 1.
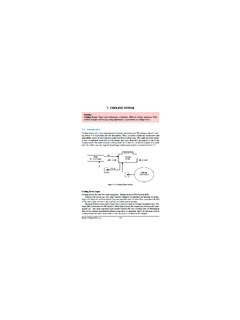
6 Define Energy Monitoring and Targeting ? Energy Monitoring and Targeting is primarily a management technique that uses Energy information as a basis to eliminate waste, reduce and control current level of Energy use and improve the existing operating procedures. It builds on the principle you can t manage what you don t measure . It essentially combines the principles of Energy use and statistics. Monitoring is essentially aimed at preserving an established pattern. Targeting is the identification of Energy consumption level, which is desirable as a management objective to work towards Energy conservation 2.
7 Briefly list Benefits that arise from an effective M&T system Ans. Enhanced Energy performance leading to increased profits. Allocation of Energy costs to individual account centres. Improved operational and investment decision making and subsequent analysis. Enhanced control of operating practices which can lead to increased product quality and reduced product loss. Improved calculation of Energy costs for projected levels of production. Improved identification of maintenance requirements. 3. List down the essential elements of Monitoring and Targeting System?
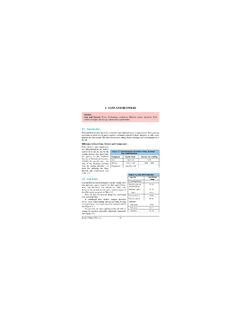
8 Ans. The essential elements of an M&T system are: Recording Analyzing Comparing Setting Targets Monitoring Reporting Controlling 4. Plot electricity consumption Vs production for the months given in table below and explain trend of Specific Energy Consumption (SEC). Month kWh Consumption kVAh consumption Production-MT kVA demand April 4,85,000 5,30,000 565 1285 May 4,30,000 4,80,000 498 1000 June 4,48,000 4,90,000 501 960 July 4,80,000 5,30,000 550 1300 Energy Monitoring and Targeting -revised (table format) 60 question bank for Energy Managers & Energy Auditors Ans Energy vs.
9 Producti on42000043000044000045000046000047000048 0000490000480500520540560580 ProductionEenrgy, kWh The SEC is varying in the range of 858 to 894 kWh/MT. The SEC has shown a reduction in trend with higher production during April 2004. Month kWh Consumption Production-MT SEC(kWh/MT) April 4,85,000 565 May 4,30,000 498 June 4,48,000 501 July 4,80,000 55 5. What are the steps involved in CUSUM analysis? 1. Plot the Energy Production graph 2.
10 Draw the best fit straight line 3. Derive the equation of the line 4. Calculate the expected Energy consumption based on the equation 5. Calculate the difference between calculated and actual Energy use 6. Compute CUSUM 7. Plot the CUSUM graph 8. Estimate the savings 6. What is the significance of calculating specific Energy consumption? The Energy should directly relate production and in-turn deriving specific Energy consumption (also known as SEC). This can also be represented by graphical method for easy comparison of variation in SEC to gain more understanding on this issue.