Transcription of Chapter 14 Energy - Finance
1 One of the opportunity costs of civilization is increase in the amount of consumption of Energy per capita per year. Many alternative sources of Energy are still being researched and tested but technologies are continually being developed and enhanced to improve Energy sources. Still oil and natural gas will continue to be the world s top two Energy sources accounting for about 60 percent of global demand. World liquid fuels consumption grew from million barrels per day (bbl/d) in 2011to reach million barrels per day (bbl/d) in 2012 thus posting a growth of percent. Energy Information Administration (EIA) expects growth will be higher over the next two years because of a moderate recovery in global economic growth. The world consumption will grow by million barrels per day (bbl/d) in 2013 and by million barrels per day (bbl/d) in 2014.
2 EIA estimates that global liquid fuels consumption outpaced production in the first quarter of 2013 resulting in an average draw in global liquid fuel stocks of million barrels per day (bbl/d), which is much higher than the average per day (bbl/d) drawn over the last 5 years. In case of the Brent crude oil spot price, EIA projects that it will fall from an average of $112 per barrel in 2012 to annual averages of $106 per barrel and $101 per barrel in 2013 and 2014, respectively. This decline in prices is also due to increase in supply of liquid fuels from non-OPEC countries. Still Energy price forecasts are highly uncertain. Thus for developing a secondary source of Energy especially electricity researches has started focusing on attainment of optimal Energy mix through fuel substitution by renewable Energy . In Pakistan oil and gas are two key components of Energy mix contributing almost 65 percent (oil 15% and gas 50%) share to the million TOE1 of Energy supplies during 2012 while share of coal and nuclear is almost 7 percent and 2 percent, respectively.
3 Pakistan is one of the largest consumers of gas in the region while Pakistan s proven coal reserves are the world s sixth largest. 1 TOE (ton of oil equivalent) is a unit of Energy . It is considered as an amount of Energy released by burning one tonne of crude oil approximately equal to 42 GJ. [1 TOE = GJ = 11, 630 Kilowatt Hours = million Btu] Thus the government intends to increase the share of coal in the overall Energy mix. There is a claim that coal quality is inferior and having low BTU (British Thermal Unit), however, in this era of modernization, technology and boilers are available that can burn any kind of coal, still there is need of true economic cost of measurement. However, there is no doubt that the strategic location of country has the attraction and significance as an attractive market and transit route for Energy , therefore merits the investor friendly policies.
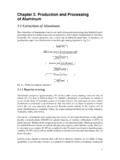
4 Pakistan s Energy Sector During calendar year 2012, net primary Energy supply remained 64, 727 thousand TOEs compared to 64,522 thousand TOEs last year thus posting growth of percent, however, on average the growth rate of net primary Energy supply remained percent for last six years. The final Energy use during current year became 40, 026 thousand TOE as almost 29 percent (18,462 thousand TOEs) were used in transformation while 10 percent (6,239 thousand TOEs) were used in diversion which include 3 percent transport and distribution losses (1,999 thousand TOE). When compared with final Energy use last year there is percent growth, as last year it was 38,842 thousand TOEs, however, on average the growth rate of final Energy use remained percent for last six years. Statistics on Energy consumption by source revealed that gas and oil had largest share as shown in following figure: Energy outages hampered economic growth of Pakistan for last few years.
5 Further since early Chapter 14 Energy Oil29%Gas44%Coal10%Eletricity16%LPG1%Fig -1: Share of Sources in Energy Consumption Source: Hydrocarbon Development Institute of Pakistan188 Pakistan Economic Survey 2012-13 2000s, the Energy sector (especially its sub sector electricity) received greater attention because of the faster rate of growth in its demand. The government put all efforts to resolve the issue still the crisis is not over. As the crisis has affected every one, thus resolving Energy crisis got immediate priority in manifestos of all political parties which competed in the election 2013. There is no doubt that there exists high correlation between growth rate of GDP and that of Energy consumption as evident from Figure 2. It can be revealed that periods of high growth rate of Energy consumption was followed by high growth rate of GDP, conversely periods of lower growth in Energy consumption caused lower growth in GDP.
6 Circular debt, weak financial position of Energy companies, falling gas production, high dependence on oil/gas (over 80%), low exploitation of indigenous coal and hydel resources and unutilized power generation capacity are some of the significant constraints leading to severe Energy shortages. Pakistan Energy Sources: Oil (Petroleum Product) The total oil resource potential is 27 million barrels with production of 66,032 barrels per day. There are almost thirteen companies involved in crude oil production. Among these thirteen, Oil and Gas Development Company Limited of Pakistan have the highest share almost 57 percent as 38,284 barrels per day is produced during 2012. United Energy Pakistan (UEP), Pakistan Petroleum Limited (PPL) and MOL Hungarian Oil and Gas Company (MOL) contributed almost 10 percent each whereas Hycarbex from USA has yet to start its production.
7 There is refining capacity of 14 million tonnes and seven oil refineries are operating in the country, however Dhodak refinery remained shutdown during 2012 due to depletion of wells. Due to massive domestic demand of oil, a large quantity of crude oil is imported every year. 24, 573 thousand barrels (67,140 barrels per day) of crude oil is extracted or produced locally while almost double of it that is 47, 104 thousand barrels was imported during 2012. Likewise 8,395 thousand tonnes of petroleum was produced domestically while 11, 507 thousand tonnes was imported. Thus in 2012 this raised the import bills to US $ 10,292 million. High Sulphur Furnace Oil (HSFO), High Speed Diesel (HSD) and Motor Spirit has the highest share in above mentioned import bills having share of 48, 32 and 16 percent, respectively. 49 percent of High Sulphur Furnace Oil (HSFO) is imported from UAE, while 27 and 12 percent is respectively imported from Saudi Arabia and Kuwait.
8 Almost 93 percent of High Speed Diesel (HSD) is imported from Kuwait while 72 percent Motor Spirit is imported from UAE, 12 percent from Oman and 10 percent from France. Since 2001-02, the consumption of petroleum products shows a continuous declining trend. The longer term trend suggests that composition of annual Energy consumption is shifting from petroleum products to other Energy sources due to volatile prices of oil. Since FY03, oil import bill has increased by 27% In FY11 alone oil bill was to the tune of US$12 billion. During FY 12 the import bill of petroleum group was US $ billion. If to look it in quantity terms it was million metric tons including million metric tons of petroleum products and million metric tons of petroleum crude. However, during July-March FY13, it posted a negative growth of percent due to fall in quantity (negative percent).
9 The main reason attributed to decline is declining prices of petroleum products globally and fall in consumption of oil/petroleum products. The main users in the consumption of petroleum products are transport and power which jointly have almost ninety percent share in total consumption as shown in Table The reason being almost 65 percent electricity is generated by thermal while fuel (Furnace Oil and Diesel Oil) consumption for 2: Relation between growth rate of GDP and Energy consumption Source: HydrocarbonDevelopment Institute of Pakistan, PBS and EA WingEnergy 189 thermal power generation is 52 percent. Table : Supply and Consumption of Oil / Petroleum ProductsOil / Petroleum Products Fiscal Year Supplies (Growth Rates) Consumption Oil Petroleum Product Oil / Petroleum Products Crude Oil Imports Local Crude Extraction Imports Production Total Consumption Growth Rate Share in Total Consumption (%)
10 Household Industry Agriculture Transport Power Other Govt % % 2001-02