Transcription of Chapter 15 Mixed Models - Carnegie Mellon University
1 Chapter 15 Mixed ModelsA flexible approach to correlated OverviewCorrelated data arise frequently in statistical analyses. This may be due to group-ing of subjects, , students within classrooms, or to repeated measurements oneach subject over time or space, or to multiple related outcome measures at onepoint in time. Mixed model analysis provides a general, flexible approach in thesesituations, because it allows a wide variety of correlation patterns (or variance-covariance structures) to be explicitly mentioned in Chapter 14, multiple measurements per subject generally resultin the correlated errors that are explicitly forbidden by the assumptions of standard(between-subjects) AN(C)OVA and regression Models .
2 While repeated measuresanalysis of the type found in SPSS, which I will call classical repeated measuresanalysis , can model general (multivariate approach) or spherical (univariate ap-proach) variance-covariance structures, they are not suited for other explicit struc-tures. Even more importantly, these repeated measures approaches discard allresults on any subject with even a single missing measurement, while Mixed mod-els allow other data on such subjects to be used as long as the missing data meetsthe so-called missing-at- random definition.
3 Another advantage of Mixed Models isthat they naturally handle uneven spacing of repeated measurements, whether in-tentional or unintentional. Also important is the fact that Mixed model analysis is357358 Chapter 15. Mixed Models often more interpretable than classical repeated measures. Finally, Mixed modelscan also be extended (as generalized Mixed Models ) to non-Normal term Mixed model refers to the use of both fixed and random effects inthe same analysis. As explained in section , fixed effects have levels that areof primary interest and would be used again if the experiment were effects have levels that are not of primary interest, but rather are thoughtof as a random selection from a much larger set of levels.
4 Subject effects are almostalways random effects, while treatment levels are almost always fixed effects. Otherexamples of random effects include cities in a multi-site trial, batches in a chemicalor industrial experiment, and classrooms in an educational explained in more detail below, the use of both fixed and random effectsin the same model can be thought of hierarchically, and there is a very closerelationship between Mixed Models and the class of Models called hierarchical linearmodels. The hierarchy arises because we can think of one level for subjects andanother level for measurements within subjects.
5 In more complicated situations,there can be more than two levels of the hierarchy. The hierarchy also plays out inthe different roles of the fixed and random effects parameters. Again, this will bediscussed more fully below, but the basic idea is that the fixed effects parameterstell how population means differ between any set of treatments, while the randomeffect parameters represent the general variability among subjects or other Models use both fixed and random effects. These correspondto a hierarchy of levels with the repeated, correlated measurementoccurring among all of the lower level units for each particular upperlevel A video game exampleConsider a study of the learning effects of repeated plays of a video game whereage is expected to have an effect.
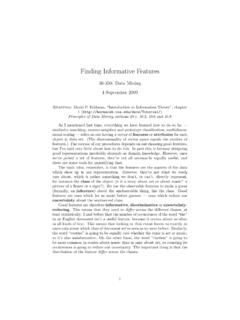
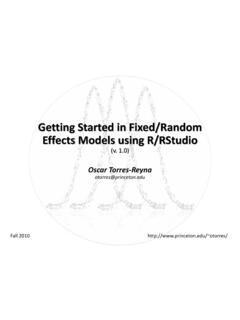
6 The data are in The quantitativeoutcome is the score on the video game (in thousands of points). The explanatoryvariables are age group of the subject and trial which represents which time thesubject played the game (1 to 5). The id variable identifies the subjects. A VIDEO GAME EXAMPLE359the the data are in the tall format with one observation per row, and multiple rowsper subject,Figure : EDA for video game example with smoothed lines for each age EDA is shown in figure The plot shows all of the data points, withgame score plotted against trial number.
7 Smoothed lines are shown for each ofthe three age groups. The plot shows evidence of learning, with players improvingtheir score for each game over the previous game. The improvement looks fairlylinear. The y-intercept (off the graph to the left) appears to be higher for olderplayers. The slope (rate of learning) appears steeper for younger this point you are most likely thinking that this problem looks like an AN-COVA problem where each age group has a different intercept and slope for therelationship between the quantitative variables trial and score.
8 But ANCOVA assumes that all of the measurements for a given age group category have uncor-related errors. In the current problem each subject has several measurements and360 Chapter 15. Mixed MODELSthe errors for those measurements will almost surely be correlated. This showsup as many subjects with most or all of their outcomes on the same side of theirgroup s fitted Mixed model approachThe solution to the problem of correlated within-subject errors in the video gameexample is to let each subject have his or her own personal intercept (and possiblyslope) randomly deviating from the mean intercept for each age group.
9 This resultsin a group of parallel personal regression lines (or non-parallel if the slope isalso random ). Then, it is reasonable (but not certain) that the errors aroundthe personal regression lines will be uncorrelated. One way to do this is to usesubject identification as a categorical variable, but this is treating the inherentlyrandom subject-to-subject effects as fixed effects, and wastes one parameter foreach subject in order to estimate his or her personal intercept.
10 A better approachis to just estimate a single variance parameter which represents how spread outthe random intercepts are around the common intercept of each group (usuallyfollowing a Normal distribution). This is the Mixed Models another point of view, in a Mixed model we have a hierarchy of levels. Atthe top level the units are often subjects or classrooms. At the lower level we couldhave repeated measurements within subjects or students within classrooms. Thelower level measurements that are within the same upper level unit are correlated,when all of their measurements are compared to the mean of all measurements fora given treatment, but often uncorrelated when compared to a personal (or classlevel) mean or regression line.