Transcription of CHAPTER 2 Fragmentation and Interpretation of Spectra 2.1 ...
1 1 CHAPTER 2 Fragmentation and Interpretation of Spectra Introduction Before discussing Fragmentation and Interpretation , it is important to understand the many ways mass Spectra are utilized. For the analytical chemist, a mass spectrum is useful for two applications. The first is the relatively simple case when the analyst is looking for a particular compound in a sample and has a reference material to compare Spectra . The second occurs when an analyst observes the presence of an unknown and wishes to identify it. The mass spectrum allows an experienced analyst to identify the compound or at a minimum narrow the possibilities down to a few compounds from the millions of potential chemicals. Then, a reference standard can be more easily selected from this knowledge to confirm the identity of this unknown. A similar situation exists for the synthetic chemist except their analytical tool box is much larger.
2 Sometimes synthetic chemists are attempting to synthesize a final product that is known (for example in an industrial process line). Here, the mass spectrum of the synthesized product is compared to a reference standard. Other times, a synthetic chemist is attempting is attempting to make a new compound where a reference standard is impossible to find. All four problems center on the same difficult task, identifying the structure of a compound under various conditions. There are three main instruments that perform this task for organic compounds, infrared spectroscopy, mass spectroscopy and nuclear magnetic resonance (NMR). It is very important that both synthetic and analytical chemists are able to choose the best tool for their particular problem. The mass spectrometer has a few advantages over the other analytical methods. Mass spectroscopy, when coupled with either gas or liquid chromatography, can analyze a complex mixture that an NMR or IR could not.
3 A MS is also the only way to determine the molecular mass of a compound. The largest advantage for analytical chemists is that mass spectroscopy can elucidate structural information from a very small amount of a compound (part per million quantities). 2 The MS has a distinctive advantage over IR spectroscopy in that there is more structural information can be determined, though the information contained in a mass spectrum is more difficult to interpret. The MS has an advantage over NMR in that it can be performed more quickly. However, both IR spectroscopy and mass spectroscopy have a distinct disadvantage when analyzing compounds with multiple functional groups. For these types of compounds and when the analyst has mg quantities of a relatively pure compound, NMR is usually the best analytical tool. As a result of these advantages and disadvantages, mass spectroscopy is normally utilized to perform three tasks.
4 The first is in analytical chemistry when there is a small concentration of analyte. The second is identifying compounds that contain few functional groups; a common procedure in industrial synthesis. The third is confirming steps in a complex synthesis of a new product to determine the molecular mass and possible some structural information. The products in the third example, however, are usually always checked by NMR. After choosing to use mass spectroscopy, the selection of gas chromatography or liquid chromatography is equally important. Gas chromatography is utilized for volatile and thermally stable compounds (up to 300 C). Liquid chromatography is usually utilized for all other compounds since it has poorer resolution than GC. As a result, this CHAPTER will focus upon interpreting structural information from the types of compounds commonly analyzed with GC-MS.
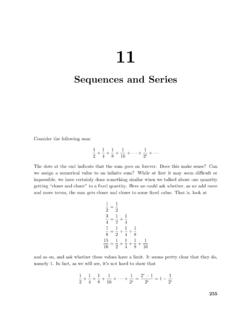
5 Once a chemist is able to determine the identity of a compound from a mass spectrum, their problem has been solved. Creation of the Spectra As sample molecules exit the GC column and enter into the mass spectrophotometer, they encounter an energy source. For the purposes of this CHAPTER , the source is an electron impact tungsten filament at 70 eV (Section ). Energy emitted from the source removes a single electron from a sample molecule. This is the most basic reaction and is illustrated by methanol below (Figure ). e- + CH3OH [CH3OH] + + 2e- 3 After these products move through the mass spectrometer, the detector is only sensitive to the positively charged molecules and is not sensitive to any neutral or radical molecules. The detector transforms the number of molecules into an electrical signal, and a computer or integrator translates this individual signal peaks into a bar graph.
6 The abundance is plotted as a function of a molecule s mass divided by its charge (m/z) on a bar graph (Figure ). Since almost all of the fragments detected by the GC-MS have only a single positive charge, m/z is also a measurement of the molecules mass. Figure Mass Spectrum of Methanol Spectra from the NIST/EPA/NIH Mass Spectral Library. Reprinted with permission from NIST. There are more bars on the graph than just the mass of the sample molecule. These other peaks are attributed to the cleavage of bonds in the original sample molecule. These fragments allow for the original structure of the sample molecule to be determined by looking at its various components (Section ). Since the energy of the source exceeds the ionization energy of the sample molecule, the excess energy that is not utilized in the removal of a single electron is distributed over various electronic, vibrational, and rotational degrees of freedom (Section ).
7 Fractionation occurs when this energy exceeds the activation energy of any 4 bond cleavage (Section ). This feature allows the instrument to distinguish between compounds with the same molecular mass and constitutional isomers. The major fragments for methanol (Figure ) can be attributed to the following reactions. [CH3OH] + CH3O+ + H [CH3OH] + CH2O+ + H2 [CH3OH] + CH3+ + OH The two most important peaks in any mass spectrum are the base peak and the molecular ion peak. The base beak (also referred to as the parent peak) is the largest peak in the spectrum. In the case of methane, the base peak is the peak at m/z 31 corresponding to the CH3O+ fragment. Since the absolute height of any peak is dependent on the concentration of the sample, the other peaks in the spectrum are referenced as a percentage of the base peak and referred to as relative abundance.
8 This normalization of peak heights greatly aids in identification of Fragmentation pattern and therefore analyte identification. The molecular ion peak corresponds to an analyte molecule that has not undergone Fragmentation . In Figure , the molecular ion peak is caused by the [CH3OH] + ion and corresponds to m/z 32. The molecular ion peak is often referred to as the M+ ion. The molecular ion is used as a reference point in identifying the other fragments. For example, the peak corresponding to m/z 15 is referred to as both M OH and M 17. Identifying the Molecular Ion Peak The molecular ion peak is both an important reference point and is integral in identifying an unknown compound. While it may seem that the molecular ion peak should be the most abundant peak in the spectrum, this is not the case for the majority of compounds. Compounds like alcohols, nitrogen containing organics, carboxylic acids, esters, and highly branched compounds may completely lack a visible molecular ion.
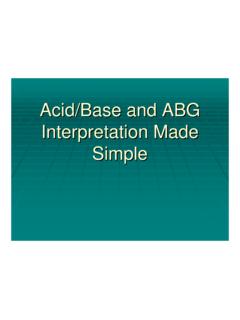
9 In these cases, it is critical that fragment peaks are not mistakenly identified as the molecular ion peak in order to avoid misidentification of an analyte. Obtaining a chemical ionization spectrum can assist in correctly identifying the molecular ion (Section ). 5 Even without a CI spectrum of the compound, other rules can assist in ruling out potential masses as the molecular ion. The nitrogen rule is one valuable tool for identifying the molecular ion. This rule indicates that if a molecular ion has an odd mass it must have an odd number of nitrogen and that a molecular ion with an even mass must lack nitrogen atoms or contain an even number of them. Since the majority of organic compounds analyzed with the GC-MS contain either zero or one nitrogen atom, the rule practically states an odd molecular ion is attributed to a single nitrogen and an even molecular ion indicates the sample lacks nitrogen (Figure ).
10 This rule only applies to compounds that contain carbon, hydrogen, nitrogen, oxygen, sulfur, halogens, and a few other less common elements. Since the majority of organic compounds that are analyzed using the GC-MS are made up of these elements, this stipulation is practically ignored. Figure The Nitrogen Rule - The mass spectrum of N,N-dimethyl-ethanamine illustrates the presence of an odd molecular ion and even fragments. Spectra from the NIST/EPA/NIH Mass Spectral Library. Reprinted with permission from NIST. This rule is a result of nitrogen s unique property. Nitrogen has an even atomic mass but bonds with three other atoms in its most stable form. Other atoms that have even molecular weights like carbon, oxygen, and 6 sulfur bond with an even number of other atoms. Atoms that bond with an odd number of other atoms like hydrogen, chlorine, bromine, and iodine have odd molecular weights.