Transcription of Chapter 2: Quantitative, Qualitative, and Mixed Research ...
1 Johnson & Christensen Educational Research , 4e 1 Chapter 2: quantitative , qualitative , and Mixed Research Lecture Notes This Chapter is our introduction to the three major Research methodology paradigms. A paradigm is a perspective based on a set of assumptions, concepts, and values that are held and practiced by a community of researchers. For the most of the 20th century the quantitative paradigm was dominant. During the 1980s, the qualitative paradigm came of age as an alternative to the quantitative paradigm, and it was often conceptualized as the polar opposite of quantitative Research . Finally, although the modern roots of Mixed Research go back to the late 1950s (and its historical roots go much further back in time), I think that Mixed Research truly became the legitimate third paradigm with the publication of the Handbook of Mixed Methods in Social and Behavioral Research (2003, by Tashakkori and Teddlie).
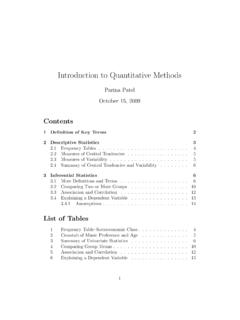
2 At the same time, Mixed Research has been conducted by practicing researchers throughout the history of Research . Characteristics of the Three Research Paradigms There are currently three major Research paradigms in education (and in the social and behavioral sciences). They are quantitative Research , qualitative Research , and Mixed Research . Here are the definitions of each: quantitative Research Research that relies primarily on the collection of quantitative data. (Note that pure quantitative Research will follow all of the paradigm characteristics of quantitative Research shown in the left column of Table ) qualitative Research Research that relies on the collection of qualitative data. (Note that pure qualitative Research will follow all of the paradigm characteristics of qualitative Research shown in the right column of Table ) Mixed Research Research that involves the mixing of quantitative and qualitative methods or paradigm characteristics.
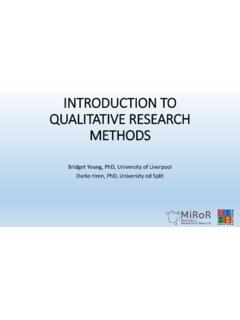
3 The mixing of quantitative and qualitative Research can take many forms. In fact, the possibilities for mixing are almost infinite. Johnson & Christensen Educational Research , 4e 2 Here is Table for your convenience and review. Johnson & Christensen Educational Research , 4e 3 quantitative Research Methods: Experimental and Nonexperimental Research The basic building blocks of quantitative Research are variables. Variables (something that takes on different values or categories) are the opposite of constants (something that cannot vary, such as a single value or category of a variable). Many of the important types of variables used in quantitative Research are shown, with examples, in Table Here is that table for your review: In looking at the table note that when we speak of measurement, the most simple classification is between categorical and quantitative Johnson & Christensen Educational Research , 4e 4 variables.
4 As you can see, quantitative variables vary in degree or amount ( , annual income) and categorical variables vary in type or kind ( , gender). The other set of variables in the table (under the heading role taken by the variable) are the kinds of variables we talk about when explaining how the world operates and when we design a quantitative Research study. As you can see, independent variables (symbolized by "IV") are the presumed cause of another variable. Dependent variables (symbolized by "DV") are the presumed effect or outcome. Dependent variables are influenced by one or more independent variables. What is the IV and DV in the relationship between smoking and lung cancer? (Smoking is the IV and lung cancer is the DV.) Whenever you want to make a claim about cause and effect ( , that changes in one IV cause changes in another IV) you have to be very careful about what are called extraneous variables ( , variables that compete with the independent variable in explaining the outcome).
5 Perhaps the DV did not change because of the IV, but it changed because of an extraneous variable! You will learn how to control for these kinds of variables in several places in your book (including below when we briefly discuss experimental Research ). Sometimes we want to understand the process or variables through which one variable affects another variable. This brings us to the idea of intervening variables (also called mediator or mediating variables). Intervening variables are variables that occur between two other variables. For example, tissue damage is an intervening variable in the smoking and lung cancer relationship. We can use arrows (which mean causes or affects) and draw the relationship that includes an intervening variable like this: Smoking Tissue Damage Lung Cancer Sometimes a relationship does not generalize to everyone; therefore, researchers often use moderator variables to show how the relationship changes across the levels of an additional variable.
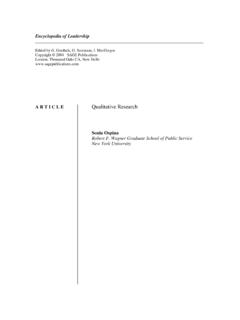
6 For example, perhaps behavioral therapy works better for males and cognitive therapy works better for females. In this case, gender is the moderator variable. The relationship be type of therapy (behavioral versus cognitive) and psychological relief is moderated by gender. Now, I will talk about the major types of quantitative Research : experimental and nonexperimental Research . Johnson & Christensen Educational Research , 4e 5 Experimental Research The purpose of experimental Research is to study cause and effect relationships. Its defining characteristic is active manipulation of an independent variable ( , it is only in experimental Research that manipulation is present). Also, random assignment (which creates "equivalent" groups) is used in the strongest experimental Research designs. Here is an example of an experiment.
7 Pretest Treatment Posttest O1 XE O2 O1 XC O2 Where: E stands for the experimental group ( , new teaching approach) C stands for the control or comparison group ( , the old or standard teaching approach) 1 and 2 subscripts stand for time: 1=time one; 2=time two. Because the best way to make the two groups similar in the above Research design is to randomly assign the participants to the experimental and control groups, let s assume that we have a convenience sample of 50 people and that we randomly assign them to the two groups in our experiment. Here is the logic of this experiment. First, we made our groups approximately the same at the start of the study by using random assignment ( , the groups are equated ). You pretest the participants to see how much they know.
8 Next, you manipulate the independent variable by using the new teaching approach with the experimental group and using the old teaching approach for the control group. Now (after the manipulation) you measure the participants knowledge to see how much they know after having participated in our experiment. Let s say that the people in the experimental group show more knowledge improvement than those in the control group. What would you conclude? In this case, we can conclude that there is a causal relationship between the IV, teaching method, and the DV, knowledge, and specifically we can conclude that the new teaching approach is better than the old teaching approach. Make sense? Johnson & Christensen Educational Research , 4e 6 Now, let s say that in the above experiment we could not use random assignment to equate our groups.
9 Let s say that, instead, we had our best teacher (Mrs. Smith) use the new teaching approach with her students in her 5th period class and we had a newer and less experienced teacher (Mr. Turner) use the old teaching approach with his 5th period class. Let s again say that the experimental group did better than the control group. Do you see any problems with claiming that the reason for the difference between the two groups is because of the teaching method? The problem is that there are alternative explanations. First, perhaps the difference is because Mrs. Smith is the better teacher. Second, perhaps Mrs. Smith had the smarter students (remember the students were not randomly assignment to the two groups; instead, we used two intact classrooms). We have a name for the problems just mentioned. It is the problem of alternative explanations.
10 In particular, it is very possible that the difference we saw between the two groups was due to variables other than the IV. In particular, the difference might have been due to the teacher (Mrs. Smith vs. Mr. Turner) or to the IQ levels of the groups (perhaps Mrs. Smith s students had higher IQs than Mr. Smith s students) We have a special name for these kinds of variables. They are called extraneous variable. It is important to remember the definition of an extraneous variable because extraneous variables can destroy the integrity of a Research study that claims to show a cause and effect relationship. An extraneous variable is a variable that may compete with the independent variable in explaining the outcome. Remember this, if you are ever interested in identifying cause and effect relationships you must always determine whether there are any extraneous variables you need to worry about.