Transcription of Chapter 2: Thinking like an Economist Principles of ...
1 Chapter 2: Thinking like an Economist Principles of Economics, 8th Edition N. Gregory Mankiw Page 1. 1. Every field has its own language and its own way of Thinking . a. Moral hazard and adverse selection. b. The single most important purpose of this book (course) is to help you learn the Economist 's way of Thinking . 2. The Economist as Scientist a. economists try to address their subject with a scientist's objectivity. b. They devise theories, collect data, and then analyze these data in an attempt to verify or refute their theories. c. The scientific method: observation, theory, and more observation. i. The interplay between theory and observation: inflation. ii. Because it is a social science, economists have less control over their data than natural scientists. iii. While teaching, economists attempt to use historical examples. iv. In research, economists attempt to correct for other forces. d. The role of assumptions i. Assumptions can simplify the complex world and make it easier to understand.
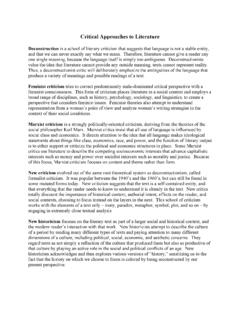
2 Ii. Assumptions can vary based on the question being asked. (1) It is reasonable to assume prices are sticky in the short run, while assuming that they are flexible in the long run. iii. Theories are judged by their results rather than the realism of their assumptions. e. economic models i. economists use models to learn about and illustrate the world. ii. These models are most often composed of diagrams and equations. iii. Our first model: The circular flow diagram is a visual model of the economy that shows how dollars flow through markets among households and firms. P. 22. (1) There are two types of decision makers: firms and households (2) There are two markets: (a) goods and services and (b) factors of production. (3) Goods and services flow in one direction and money in the other. (4) Figure 1: The Circular Flow. P. 23. (5) This is a simple model as it ignores the roles of government and international trade, for example. iv. Our second model: The production possibilities frontier is a graph that shows the various combinations of output that the economy can possibly produce given the available factors of production and the Chapter 2: Thinking like an Economist Principles of Economics, 8th Edition N.
3 Gregory Mankiw Page 2. available production technology. P. 24. (1) Figure 2: The Production possibilities Frontier. P. 24. (2) It illustrates the potential for inefficient outcomes. (3) This illustrates the important principle of economics that most choices involve tradeoffs (opportunity costs). (4) Efficiency and tradeoffs. (5) Figure 3: A Shift in the Production possibilities Frontier. P. 26. (6) The production possibilities frontier simplifies a complex economy to highlight some basic but powerful ideas: scarcity, efficiency, trade-offs, opportunity cost, and economic growth. f. Microeconomics and Macroeconomics i. Microeconomics is the study of how households and firms make decisions and how they interact in markets. P. 27. ii. Macroeconomics is the study of economy wide phenomena, including inflation, unemployment, and economic growth. P. 27. iii. Microeconomics and macroeconomics are closely intertwined. iv. Ultimately, all decisions are made by individuals, so microeconomics is the basis of all economics.
4 3. The Economist as Policy Maker a. Positive versus normative analysis i. Positive statements are claims that attempt to describe the world as it is. P. 28. ii. Normative statements are claims that attempt to prescribe how the world should be. P. 28. b. economists in Washington i. If President Truman wanted to find a one armed Economist , he probably should have checked with some of my friends. ii. In 1981-2, I was a Senior Economist on the President's Council of economic Advisers. 4. Why economists ' Advice is Not Always Followed a. Mankiw, who was Chairman of the Council of economic Advisers under President Bush, is way too kind. b. Politicians make decisions based on self-interest, which is based on their desire to be re-elected, that favors the parties from whom they have received campaign contributions or the group of voters from whom they want support in the future. c. Voters in turn prefer programs that benefit them self-interest. 5. Why economists Disagree Chapter 2: Thinking like an Economist Principles of Economics, 8th Edition N.
5 Gregory Mankiw Page 3. a. There are two basic reasons: i. Economist may disagree about the validity of alternative positive theories about how the world works. (1) The difference between assuming prices are rigid or flexible. (2) Whether individuals will save more with a consumption tax depends on how savings responds to it return. (3) The multipler effects of government expenditures. ii. economists may have different values and, therefore, different normative views about what policy should try to accomplish. (1) While much of economics suggests a limited role for the government, many economists vote for candidates who argue for a larger role in the economy for the government. b. Perception versus reality i. There is much more agreement among economists than is commonly recognized. ii. Table 1: Propositions about Which Most economists Agree. P. 32. (1) 2. Tariffs and import quotas usually reduce general economic welfare. (93%). (2) 17. A minimum wage increases unemployment among young and unskilled workers.
6 (79%). (3) 19. Effluent taxes and marketable pollution permits represent a better approach to pollution control than the imposition of pollution ceilings. (78%). iii. Ask the Experts: Ticket Resale, P. 32. (1) Laws that limit the resale of tickets for entertainment and sports events make potential audience members for those events worse off on average. (2) 80% agree, 12% are uncertain and 8% disagree. 6. Let's Get Going 7. Why You Should Study Economics, P. 33. a. The Dismal Science? Hardly by Robert D. McTeer, Jr. b. This a great article 8. Summary 9. Appendix Graphing: A brief review a. This is for your benefit as you are not responsible for appendices unless I. say so. b. Graphs of a single variable Chapter 2: Thinking like an Economist Principles of Economics, 8th Edition N. Gregory Mankiw Page 4. c. Graphs of two variables: The coordinate system. i. Figure A-1: Types of graphs. P. 37. d. Curves in the coordinate systems i. Figure A-2: Using the coordinate system. P.
7 38. ii. Table A-1: Novels purchased by Emma, P. 39. iii. Figure A-3: Demand curve, P. 40. iv. Figure A-4: Shifting demand curves. P. 41. e. Slope i. Figure: A-5: Calculating the slope of a line. P. 42. f. Cause and effect i. Omitted variables (1) Figure A-6: Graph with an omitted variable. P. 43. ii. Reverse Causality (1) Figure A-7: Graph suggesting reverse causality. P. 44.