Transcription of CHAPTER 6 Ease of doing business score and ease of doing ...
1 77 CHAPTER 6 ease of doing business score and ease of doing business rankingDoing business presents results for two aggregate measures: the ease of doing business score and the ease of doing busi -ness ranking, which is based on the ease of doing business score . The ease of doing business ranking compares economies with one another; the ease of doing business scores bench-mark economies with respect to regulatory best practice, showing the proximity to the best regulatory performance on each doing business indicator. When compared across years, the ease of doing business score shows how much the reg-ulatory environment for local entrepreneurs in an economy has changed over time in absolute terms, whereas the ease of doing business ranking shows only how much the regulatory environment has changed relative to that in other business 202078 ease of doing business scoreThe ease of doing business score measures an economy s performance with respect to a measure of regulatory best practice across the entire sample of 41 indicators for 10 doing business topics (the employing workers and contracting with the government indicators are excluded).
2 For starting a business , for example, Georgia and New Zealand have the lowest number of procedures required (1). New Zealand also holds the shortest time to start a business ( days), whereas Rwanda and Slovenia have the lowest cost ( ). Australia, Colombia, and 118 other economies have no paid-in minimum capital requirement (table ). Calculation of the ease of doing business scoreCalculating the ease of doing business score for each economy involves two main steps. In the first step individual component indicators are nor-malized to a common unit where each of the 41 component indicators y (except for the total tax and contribution rate) is rescaled using the linear transformation (worst y)/(worst best). In this formulation the highest score represents the best regulatory performance on the indicator across all economies since 2005 or the third year in which data for the indicator were collected.
3 Both the best regulatory performance and the worst reg-ulatory performance are established every five years1 on the basis of the doing business data for the year in which they are established and remain at that level for the five years regardless of any changes in data in interim years. Thus an economy may establish the best regulatory performance for an indicator even though it may not have the highest score in a subsequent year. Conversely, an economy may score higher than the best regulatory performance if the economy reforms after the best regulatory performance is set. For example, the best regulatory performance for the time to get elec-tricity is set at 18 days. In the Republic of Korea it now takes 13 days to get electricity, and in the United Arab Emirates it takes just 7 days. Although the two economies have different times, both economies score 100 on the time to get electricity because they have exceeded the threshold of 18 scores on indexes such as the strength of legal rights index or the quality of land administration index, the best regulatory performance is set at the highest possible value (although no economy has yet reached that value in the case of the latter).
4 For the total tax and contribution rate, consistent with the use of a threshold in calculating the rankings on this indicator, the best regulatory performance is defined as the total tax and contribution rate at the 15th percentile of the overall distribution for all years included in the analysis up to and including doing business 2015. For the time to pay taxes, the best regulatory performance is defined as the lowest time recorded among all economies that levy the three major taxes: profit tax, labor taxes and mandatory contributions, and value added tax (VAT) or sales tax. For the different times to trade across borders, the best regulatory performance is defined as one hour even though in many econ-omies the time is less than that. 79 ease of doing business score and ease of doing business rankingTABLE Which economies set the best regulatory performance?Topic and indicatorEconomy establishing best regulatory performanceBest regulatory performanceWorst regulatory performanceStarting a businessProcedures (number) Georgia; New Zealand 118aTime (days)New Zealand (% of income per capita)Rwanda; capital (% of income per capita) Australia; Colombia; Mauritiusc with construction permits Procedures (number) No economy was a best performer as of May 1, (days) No economy was a best performer as of May 1, (% of warehouse value) No economy was a best performer as of May 1, quality control index (0 15)China; Luxembourg; United Arab Emiratese150fGetting electricity Procedures (number) Germany; Kenya; Republic of Koreag39aTime (days) Republic of Korea; St.
5 Kitts and Nevis; United Arab Emirates18248bCost (% of income per capita) China; Japan; United Arab , of supply and transparency of tariffs index (0 8)Costa Rica; Ireland; Malaysiah80fRegistering property Procedures (number) Georgia; Norway; Portugali113aTime (days) Georgia; Qatar 1210bCost (% of property value) Saudi Arabia of land administration index (0 30)No economy has reached the best performance yet. 300fGetting credit Strength of legal rights index (0 12) Brunei Darussalam; Montenegro; New Zealandj120fDepth of credit information index (0 8) Ecuador; Israel; United Kingdomk80fProtecting minority investors Extent of disclosure index (0 10) China; Malaysia; United Kingdoml100fExtent of director liability index (0 10) Cambodia; Kenya; United Arab Emirates100fEase of shareholder suits index (0 10)Djibouti100fExtent of shareholder rights index (0 6)India; Kazakhstan; Maltam60fExtent of ownership and control index (0 7)Bahrain; Colombia; Uzbekistann70fExtent of corporate transparency index (0 7)France; Norway; Taiwan, Chinao70fPaying taxes Payments (number per year) Hong Kong SAR, China 363bTime (hours per year) Singapore49p696bTotal tax and contribution rate (% of profit) Canada; Denmark; index (0 100)No economy with both CIT and VAT has reached the best performance to comply with VAT refund (hours)Croatia; Republic of Korea.
6 Netherlandss050bTime to obtain VAT refund (weeks)Austria; to comply with corporate income tax correction(hours)Estonia; Lithuania; to complete a corporate income tax correction(weeks)Japan; Sweden; United Statesu0v32b(table continued on next page) doing business 202080 TABLE Which economies set the best regulatory performance? (Continued)Topic and indicatorEconomy establishing best regulatory performanceBest regulatory performanceWorst regulatory performanceTrading across bordersTime to exportDocumentary compliance (hours)Canada; Poland; Spainw1x170bBorder compliance (hours)Austria; Belgium; Denmarky1x160bCost to exportDocumentary compliance (US$)Hungary; Luxembourg; Norwayz0400bBorder compliance (US$)France; Netherlands; Portugalaa01,060bTime to importDocumentary compliance (hours)Republic of Korea; Latvia; New Zealandbb1x240bBorder compliance (hours)Estonia; France; Germanycc1x280bCost to importDocumentary compliance (US$)Iceland; Latvia; United Kingdomdd0700bBorder compliance (US$)Belgium; Denmark; Estoniaee01,200bEnforcing contracts Time (days) Singapore1201,340bCost (% of claim) of judicial processes index (0 18)No economy has reached the best performance yet.
7 180fResolving insolvency Recovery rate (cents on the dollar) of insolvency framework index (0 16) No economy has reached the best performance yet. 160fSource: doing business : CIT = corporate income tax; VAT = value added tax. a. Worst performance is defined as the 99th percentile among all economies in the doing business Worst performance is defined as the 95th percentile among all economies in the doing business Another 117 economies also have a paid-in minimum capital requirement of No economy was a best performer as of May 1, 2019, due to data Another three economies score 15 out of 15 on the building quality control Worst performance is the worst value In 25 other economies it takes no more than three procedures to get an electricity Another 23 economies score 8 out of 8 on the reliability of supply and transparency of tariffs Two more economies record one procedure to register Two additional economies score 12 out of 12 on the strength of legal rights Another 50 economies score 8 out of 8 on the depth of credit information Another 10 economies score 10 out of 10 on the extent of disclosure Another 16 economies score 6 out of 6 on the extent of shareholders rights Another six economies score 7 out of 7 on the extent of ownership and control Another 10 economies score 7 out of 7 on the extent of corporate transparency Defined as the lowest time recorded among all economies in the doing business sample that levy the three major taxes.
8 Profit tax, labor taxes and mandatory contributions, and VAT or sales Another 30 economies have a total tax and contribution rate equal to or lower than of Defined as the highest total tax and contribution rate among the 15% of economies with the lowest total tax and contribution rate in the doing business sample for all years included in the analysis up to and including doing business Another eight economies also have a compliance time for VAT refund of 0 Another 11 economies also have a compliance time for corporate income tax correction of no more than Another 96 economies also do not impose a corporate income tax Time to complete a corporate income tax correction is 0 when there is no audit measured for the economy. No audit is measured when the percentage of cases exposed to an additional review is less than 25%.w. Another 23 economies also have a documentary compliance time to export of no more than 1 Defined as 1 hour even though in many economies the time is Another 16 economies also have a border compliance time to export of no more than 1 Another 17 economies also have a documentary compliance cost to export of Another 16 economies also have a border compliance cost to export of Another 27 economies also have a documentary compliance time to import of no more than 1 Another 22 economies also have a border compliance time to import of no more than 1 Another 27 economies also have a documentary compliance cost to import of Another 25 economies also have a border compliance cost to import of of doing business score and ease of doing business rankingIn the same formulation.
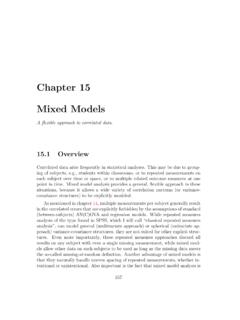
9 To mitigate the effects of extreme outliers in the distributions of the rescaled data for most component indicators (very few economies need 700 days to complete the procedures to start a business , but many need 9 days), the worst performance is calculated after the removal of outliers. The definition of outliers is based on the distribution for each component indicator. To simplify the process two rules were defined: the 95th percentile is used for the indicators with the most dispersed distribu-tions (including minimum capital, number of payments to pay taxes, and the time and cost indicators), and the 99th percentile is used for number of procedures. No outlier is removed for component indicators bound by definition or construction, including legal index scores (such as the depth of credit information index, extent of disclosure index, and strength of insolvency framework index) and the recovery rate (figure ). In the second step for calculating the ease of doing business score , the scores obtained for individual indicators for each economy are aggregated through simple averaging into one score , first for each topic and then across all 10 topics: starting a business , dealing with construction permits, getting electricity, registering property, getting credit, protecting minority inves-tors, paying taxes, trading across borders, enforcing contracts, and resolving insolvency.
10 More complex aggregation methods such as principal compo-nents and unobserved components yield a ranking nearly identical to the simple average used by doing Thus doing business uses the simplest method: weighting all topics equally and, within each topic, giving equal weight to each of the topic An economy s score is indicated on a scale from 0 to 100, where 0 rep-resents the worst regulatory performance and 100 the best regulatory performance. All topic ranking calculations and the ease of doing business ranking calculations are based on scores without How are scores calculated for indicators?Source: doing business regulatoryperformance(99th percentile):9 procedures101002550752550750100234576109 8 Getting electricity scorefor proceduresa. Getting electricity in Namibiab. Protecting minority investors in NamibiaProcedures (number)Protecting minority investors scorefor extent of disclosure indexExtent of disclosure index (0 10)12345678910 Best regulatoryperformance:10 pointsWorst regulatoryperformance:0 pointsBest regulatoryperformanceBest regulatoryperformance:3 proceduresNamibiaNamibiaBest regulatoryperformanceDOING business 202082 The difference between an economy s score in any previous year and its score in doing business 2020 illustrates the extent to which the economy has changed in its business regulatory environment over time.